
What’s Shaping Canada’s Teachers? Decoding Education Syllabi Trends

I just discovered a promising data resource: the Open Syllabus project. The project gleefully hoovers up descriptions of post secondary course syllabi from around the world. As of this writing, “the world” still includes Canada, so you just know that you’re in for some fun.
The project does such a good job being transparent - in particular by describing their dataset’s limitations - that I nearly gave up and moved on. In the end, obviously, I decided to stick around. And as long as we don’t lose sight of the fact that this data is incomplete and in some ways speculative, we should be fine.
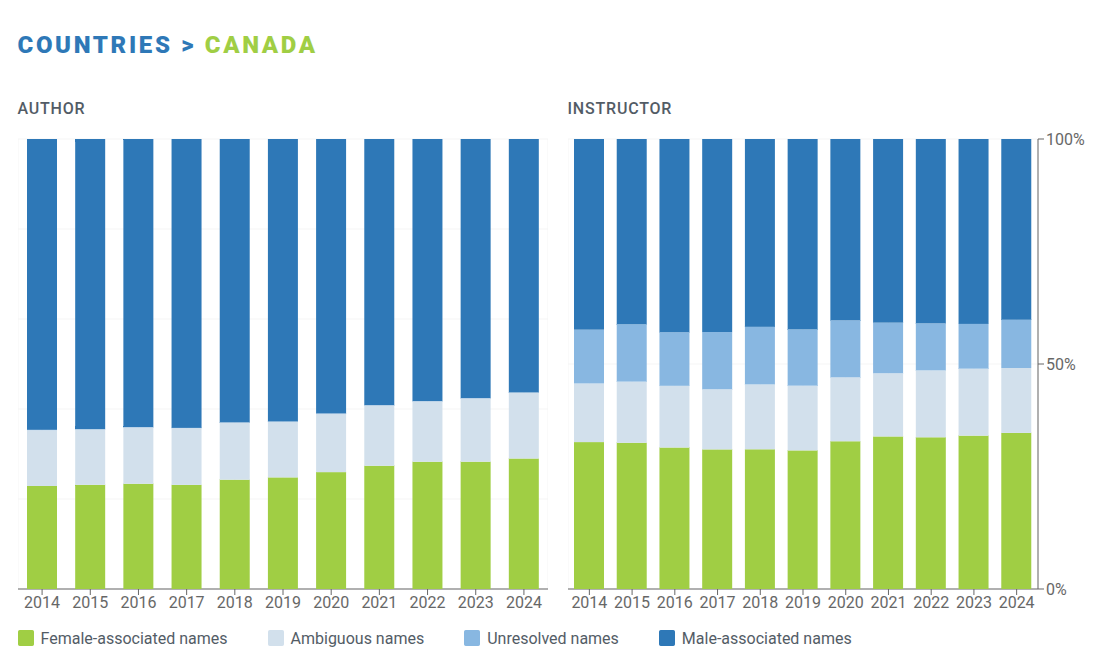
Here’s an example that I believe supports my confidence. The following graph (generated on the Open Syllabus site) represents the gender breakdown for both syllabus content authors and course instructors across all fields in Canadian schools. Since these are assumptions mostly based on assessing first names, there’s a fairly large set of ambiguous results. Unlike what we’ve seen in post secondary student populations - where 58 percent of students are women - there still seem to be more male than female instructors in Canadian faculties.
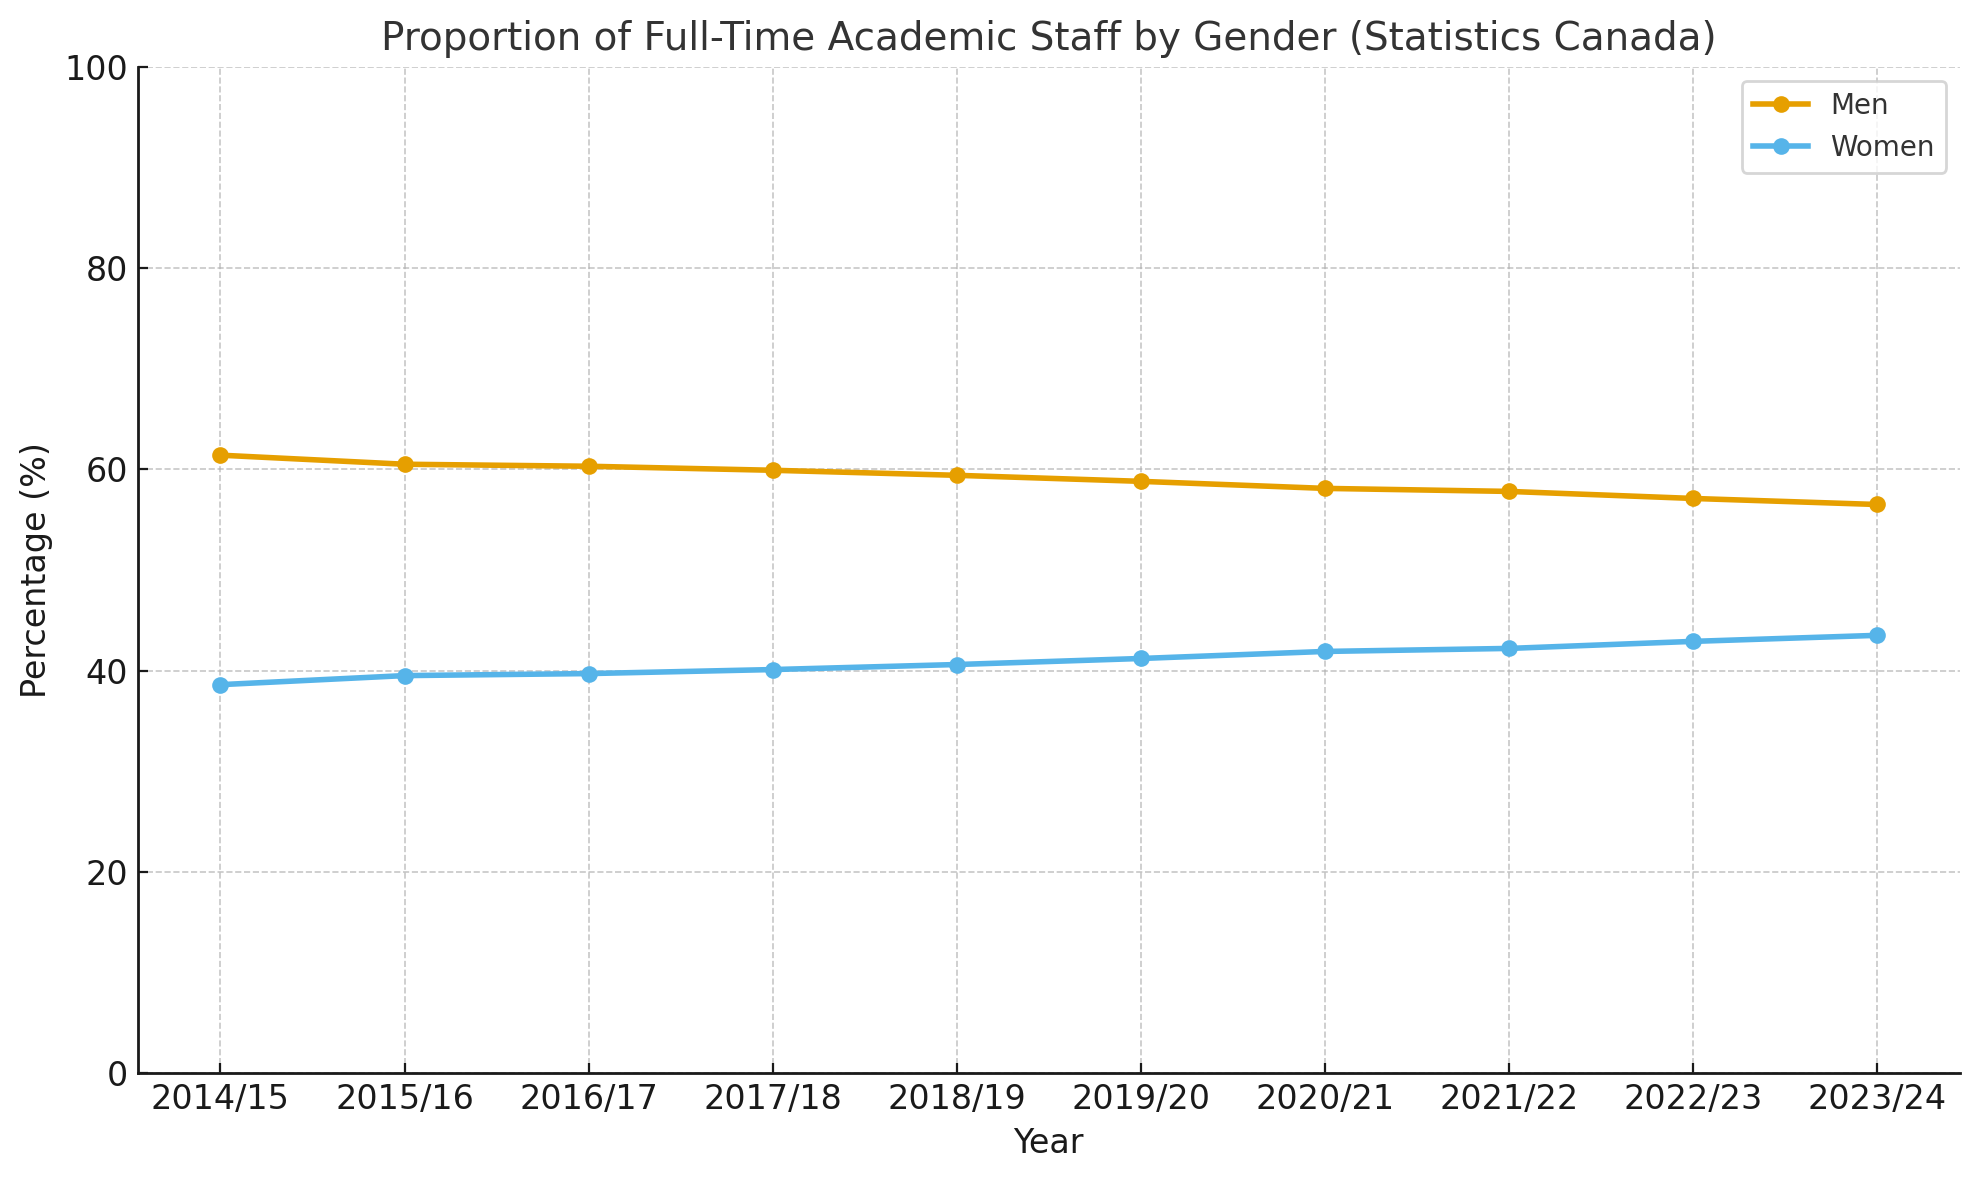
But the truth is that the Open Syllabus results aren’t all that different from Statistics Canada data covering full-time academic staff. And the overall trend towards female dominance is clear:
What methodologies are student teachers learning?
Open Syllabus allows us to sample syllabus content by keyword over time. This should give us a sense of what universities and colleges are teaching and how much emphasis they give topics relative to each other.1 In other words, a phrase or keyword that, in 2014, appeared in, say, 20 percent of all Canadian syllabi but has since dropped to just 10 percent is obviously declining in importance. But that topic might still get more attention than a topic with a density of less than a single percentage.
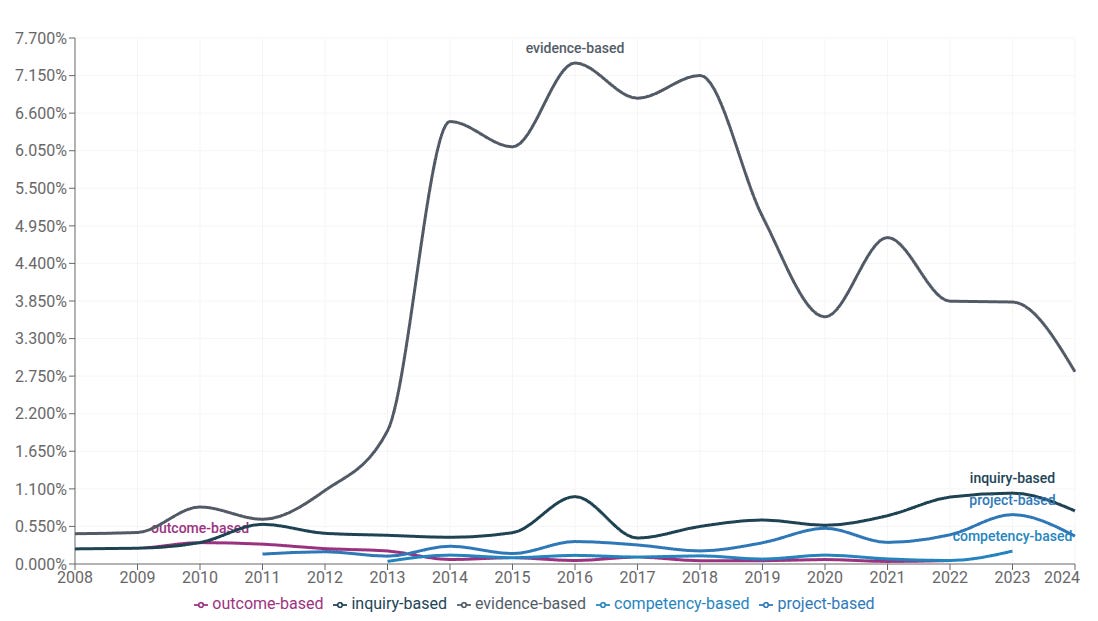
Let’s see how that might play out in practice. Here’s a graph comparing keyword density among five education methodology-related phrases. The results are specific to courses at Canadian faculties of education. You can see how the presence of discussions of “evidence-based” methodologies - which hit density rates higher than seven percent around 2016 - is receiving far more attention than some parallel ideas. Although it sure looks as though evidence-based thinking has more recently been losing ground.
I’m not sure how much we can read into the steady 15-year decline in “curriculum” usage shown in the next graph. It’s possible that the change reflects a growing emphasis on competencies over rigid “curriculum” structures in some provincial policy expectations.
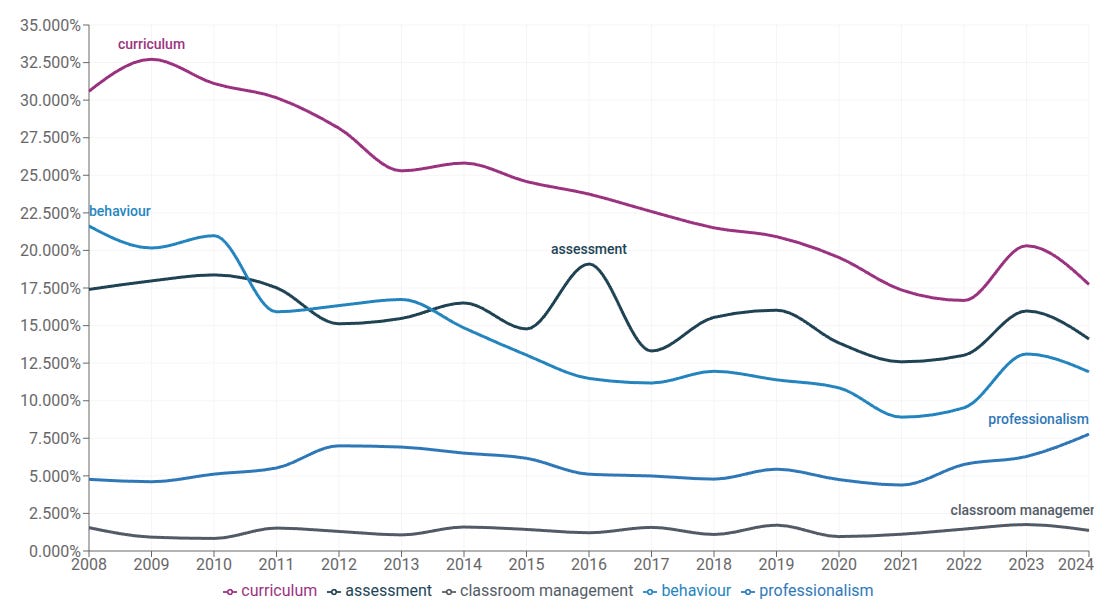
As that graph shows, “behaviour” also seems to have fallen out of favour during this time, dropping from a 22 percent density down to around nine percent before picking up again post-COVID. It’s possible that this change followed some of the same influences as “curriculum”. But they might be the result of a shift away from traditional behaviorist frameworks toward more holistic, student-centered approaches (influenced by rising emphases on social-emotional learning). The partial recovery after 2022 might be part of a reaction and rebalancing.
What curriculum topics are faculties focusing on?
This next graph seems to show changes to how much attention is paid to individual curriculum domains during teacher training. “History” lost nearly half of its focus leading up to what’s looking more and more like the pivotal year 2022. That year, as you can see, saw a brief spike in interest pretty much across the board.
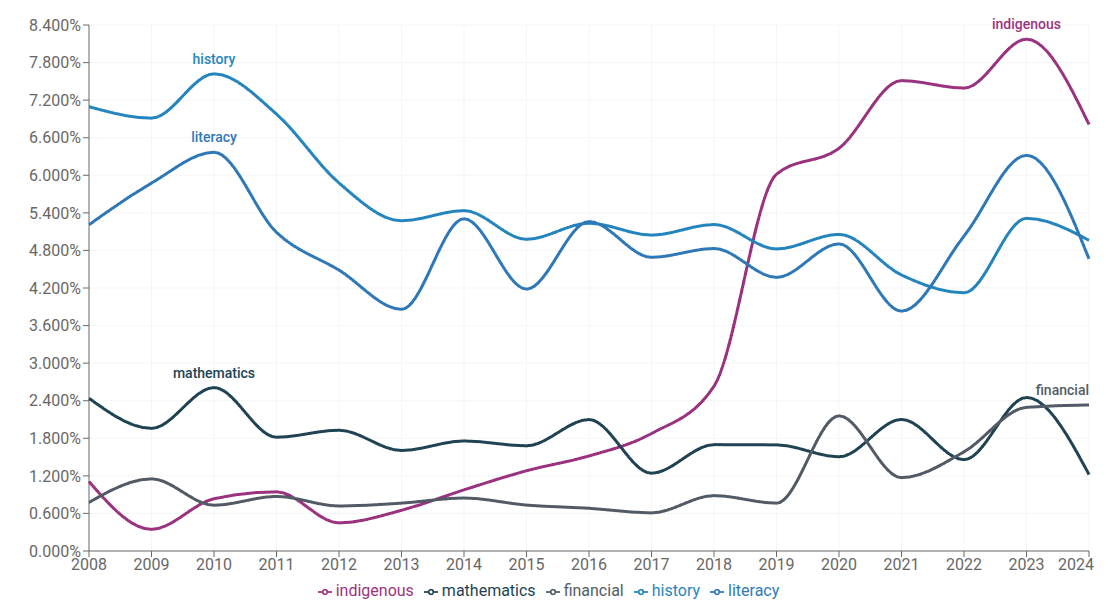
What was going on there? Syllabi may have been revised to explicitly list subjects and standards to demonstrate compliance with new post-COVID provincial accreditation and accountability expectations. Although that might have been little more than a box-checking exercise rather than an actual curriculum overhaul.
Of course, the big story from that graph is the jump of “indigenous” from less than one percent to eight percent. That’s clearly a reflection of political events in the larger society.
It’s important to keep an eye on the numbers shown in each of these graphs. Keyword densities in the previous graph, for instance, ranged from 0.5 percent to 8 percent. But those are at an entirely different scale than the 20 to 33 percent we saw for “curriculum”.
Here’s where I’m going with this. The next example shows significant dominance back in 2010 of popular trending keywords like “diversity” and “equity”. But even though the density of “diversity” fell as we moved through the decade, it’s still showing up around 10 percent of education faculty syllabi.
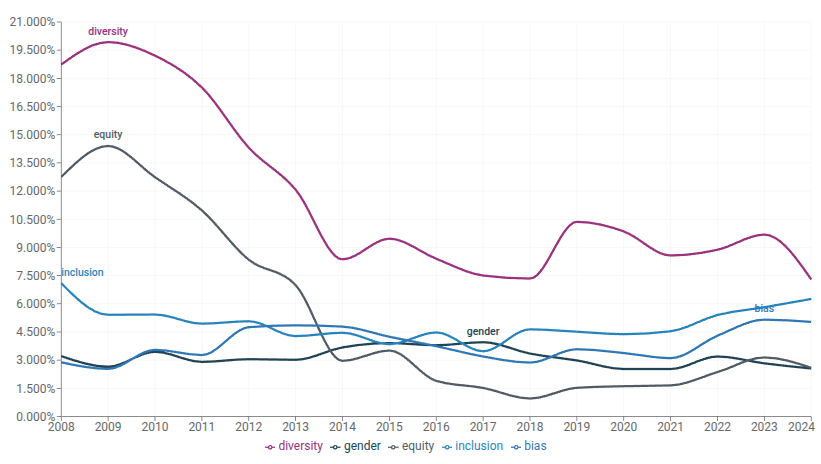
For context, that 10 percent is higher than any curriculum domain (like history or literacy) and well above even "evidence-based" at its peek. That context is important if we’re trying to capture the mood and ideological leanings inside these faculties. And that’s especially important if we want to reliably predict what public school classrooms will look like once the current student cohort graduates.
For more education-specific insights from The Audit, check out the complete collection, or enjoy these recent posts:
Inside the Quiet Power of the Ontario College of Teachers

As we’ve already discovered, professional regulatory associations are critical parts of any functioning society, but they don’t always deliver ideal results. This post - in what I hope will eventually become a series - will look at another professional group.
Why Are Ontario's Public Schools So Violent?

Ontario’s Auditor General just released a performance audit on the Toronto District School Board. I’m sure it’ll surprise exactly no one that “financial and capital resources are not consistently allocated in the most cost-effective or efficient way” or that “The effective management of operations was not always being measured and assessed for internal …
Although it’s no secret that what actually happens in a classroom won’t always accurately reflect the course syllabus. But we can at least see what institutions want us to think is going on.
Yet another argument for home schooling. Or even, vouchers and school competition.
Interesting data. I like how the graph with "indigenous" at the top and "financial" falling off a cliff at the bottom mirrors the transition from a bankrupt welfare state to authoritarian tyranny as laid out in Alexander Tytler's thesis of over two centuries ago (on how all democracies end). The cultural Marxist inspired inversion of the apartheid of the Indian Act through an activist Judiciary at the top of the grievance industry responsible for industrial scale grift while the PM takes a knee in joining a blood libel over outrageous allegations none of which have been proven nor will be allowed to be (disproven). This captures the attention while public debt grows beyond any hope of being paid off. Bread and Circuses (also mirroring the decline of "History").