

Housing prices in Canada’s larger cities have dropped over the past 12 months, which has certainly helped ease the affordability crisis. But even current prices are nowhere near a range that’s useful for hundreds of thousands of younger working Canadians.
For years now, governments at all levels have been promising to fix the problem by increasing housing supply through new construction. Between them, they’ve plowed countless billions into tax credits, subsidies, and loan guarantees. Have those efforts made any measurable difference?
One helpful - but incomplete - proxy for tracking new construction is the number of building permits issued by municipalities over time. Fortunately we have excellent data for just that. In fact, we have a choice: we could use either the numbers of permits that were issued or the total value of the projects they represent. As you can see from this chart, there doesn’t seem to be much advantage one way or another, since they seem to closely track each other:
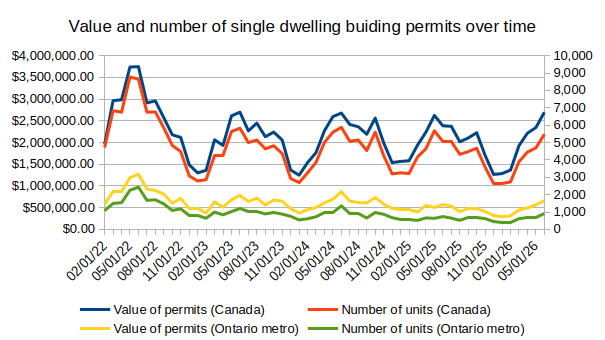
So we’ll go with numbers of permits issued. Since the primary focus of many government initiatives has been affordable housing, we should begin with multiple family dwellings. This graph visualizes monthly permits issued for all major projects across the country involving what are referred to as “multiple dwellings”:
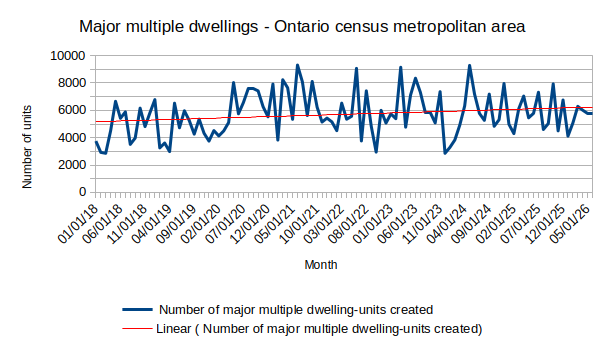
As you can see, there’s been some growth since the earliest data available in 2018, but statistically, that growth has been minimal.
By contrast, this graph covers all new dwelling units built as part of major projects (rather than just multi-family).
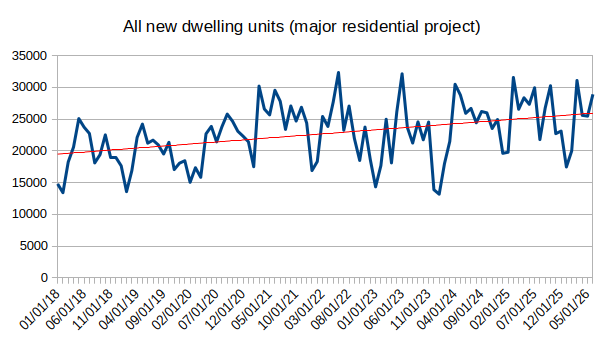
If you compare the red trend lines from those charts, you should be able to see the upward slope in the “all new dwellings” chart is a lot steeper than the one in “multiple dwellings”.
How much steeper? The actual numbers allow us to confidently say that Canadian building permits for all new dwelling units do indeed show a highly statistically significant upward trend since 2018 (p < 0.000001).
However, even after controlling for monthly seasonality and serial correlation, the multiple-dwelling growth is not meaningful. And the difference between the two trends is itself highly statistically significant (p ≈ 0.000003).
This suggests that those billions spent by governments haven’t accomplished a whole lot. Now, of course, the big question is who can we blame for all that wasted money? Surprisingly, there seems to be evidence that it wasn’t primarily the federal government’s fault. That’s because there are significant performance differences between provinces.
When I compared the number of permits issued by each province in June 2018 with June 2026, I see that not all provinces have been equal. As you can see from the next graph, Of all ten provinces, only Ontario and BC approved fewer permits in 2026 than in 2018:
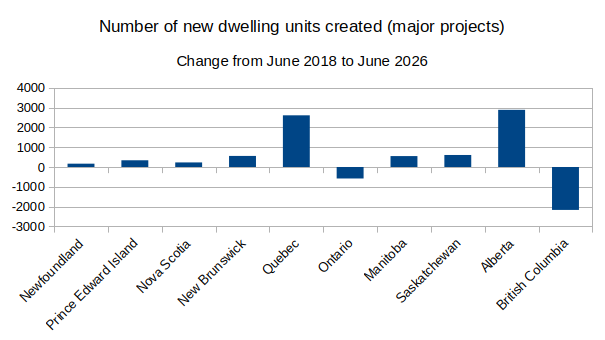
When you consider how it’s people in Ontario and BC who are suffering the most from housing costs, that doesn’t look good. But guess what? Responsibility might not even lie with the provinces.
This final graph compares changes in permitting numbers among large metropolitan regions in both Ontario and BC:
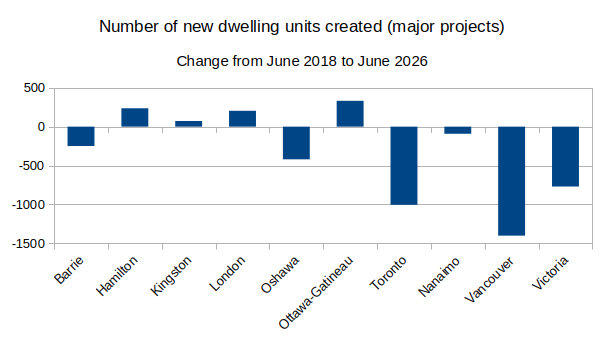
As you can see, Hamilton, London, and Ottawa-Gatineau managed to improve their permitting rates while Toronto, Vancouver, and Victoria didn’t just drop the ball, they seem to have completely lost it somewhere near the bottom of an long-abandoned coal mine.
Or did they? There’s an argument to be made that federal and provincial incentives made some sense. And it’s possible that municipal governments really did find ways to streamline their approval processes.
But if developers don’t think they’ll make back their investments from a project, they won’t bother applying for permits. Between the recent crash in the condo market and rising interest rates and construction supply costs, many projects simply no longer make economic sense.
Sure, government policy changes could make a difference at the margins. I’ve already written about building code standards that fail to accomplish their stated goals while raising construction costs. And it’s no secret that the complexity and costs of government compliance can add more than 20 percent to the purchase price of a new single home.
The bottom line is that government programs seem to have had a minimal positive impact on the crisis. However, they’re not necessarily directly responsible for new housing supply showdowns in large cities.
Which suggests that there may not be all that much governments can do
What's Hiding Inside Canada's Non-Profit Sector?

You’d be amazed how much money you can earn through a non-profit. Of course, because (non-charitable) non-profit financials don’t have to be made public, the rest of us will never know just how much. However, since the primary funding (and tax-free status) for many non-profits comes from taxpayer sources, it’s worth trying to unwrap as much of the myste…
Why Aren't Federal Affordable Housing Initiatives Designed to Build Affordable Housing?

I recently came across a fascinating piece analyzing why publicly-funded affordable housing projects cost so much more in Chicago than in Houston. Much of the problem came down to the criteria used by the Illinois Housing Development Authority (IHDA) to allocate tax credits:
Solving the Housing Affordability Crisis With This One Cool Trick

The Audit has a growing library of posts addressing the housing crisis. I’m particularly proud of my Solving Canada’s Housing Crisis because of how it presents a broad range of practical approaches that have been proposed and attempted across many countries and economies. But the truth is that the