
Do Indigenous Canadians Benefit From Government Support?

Aside from payments for pensions and benefits through Employment and Social Development Canada and for interest payments on our debt, Canada spends more on indigenous matters than anything else.
This table represents some of the larger items from just Crown-Indigenous Relations and Northern Affairs Canada in their 2021, 2022, 2023, and 2024 budgetary allotments documents.
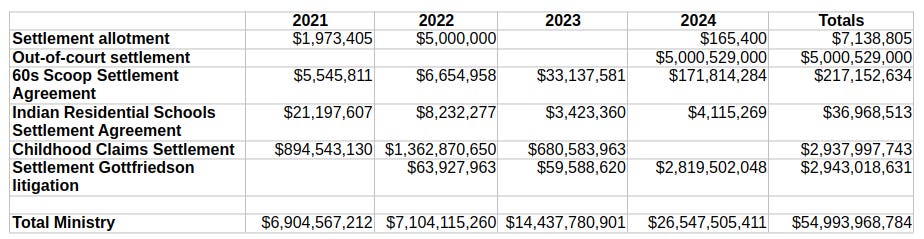
Those numbers don’t include 2024 amounts for $21 billion for the Department of Indigenous Services, $13 million for the Northern Indigenous Economic Opportunities Program, $56 million in grants to support the Indigenous Languages and Cultures Program, and $109 million in contributions to support the Indigenous Languages and Cultures Program.
Since this cluster of programs clearly sits at the very center of the things our government does, it could probably benefit from some visibility. Don’t get me wrong: it’s our duty to honour obligations which, for instance, are the result of court rulings on historical treaty settlements. This post isn’t about the legality of any of this. My interest here is in what indigenous people get out of those programs.
So I’m going to try to track the welfare of Canada’s indigenous populations over time to see whether all that money has made a difference.
I’ll begin with unemployment. The gap between indigenous unemployment rates and those of the general population does seem to have narrowed. Between 2012 and 2016 the average difference was 5.3 percentage points, while it was just 3.2 points between 2021 and 2024. Nevertheless, Statistics Canada numbers continue to show a persistent disparity:

Similarly, the distance in 2021 between median income for indigenous workers ($36,400) and all workers ($43,200) is effectively unchanged from the 2016 figures for “aboriginal identity” ($30,246) and all Canadians ($37,231).
You will see reports praising the virtues of a growing Indigenous Gross Domestic Income (GDI). But it’s hard to see how that’s being reflected in the street-level experiences of real people. Perhaps the GDI shares some of the limitations of its cousin, Gross Domestic Product (GDP).
Indigenous educational attainment has clearly been improving over the past few census cycles. This census data shows us what’s been happening:

As you can see for yourself, there’s been a healthy decline in the numbers of people without even a high school diploma alongside clear increases in university degrees. On the other hand, trade and apprenticeship certifications have been dropping.
Those trends could possibly help explain why income and employment measures have been largely stagnant. Perhaps the declining economic value of a university degree means that such educational tracks are not necessarily always the best approach. It’s also possible that various government support programs are distorting incentives and leading, over the long run, to non-ideal outcomes.
We should also take a quick look at some basic living standards. As of 2021 at least, off-reserve Indigenous housing was still a statistical disaster:
“In 2021, about one in six Indigenous people (16.4%) in Canada lived in a dwelling that was in need of major repairs, higher than among the non-Indigenous population (5.7%)”... In 2021, “roughly one in six (17.1%) Indigenous people lived in crowded conditions where the dwelling did not have enough bedrooms for the size and composition of the household according to the National Occupancy Standard (NOS), thus indicating unsuitable housing. This rate was much higher than that seen among the non-Indigenous population at 9.4%.”
Long-term drinking water advisories on reserves have been an ongoing embarrassment across the country. In 2020 the federal government claimed to have devoted more than $3.5 billion dollars to the problem in the years since 2016. This graph, based on Statistics Canada data, shows there have been serious improvements:
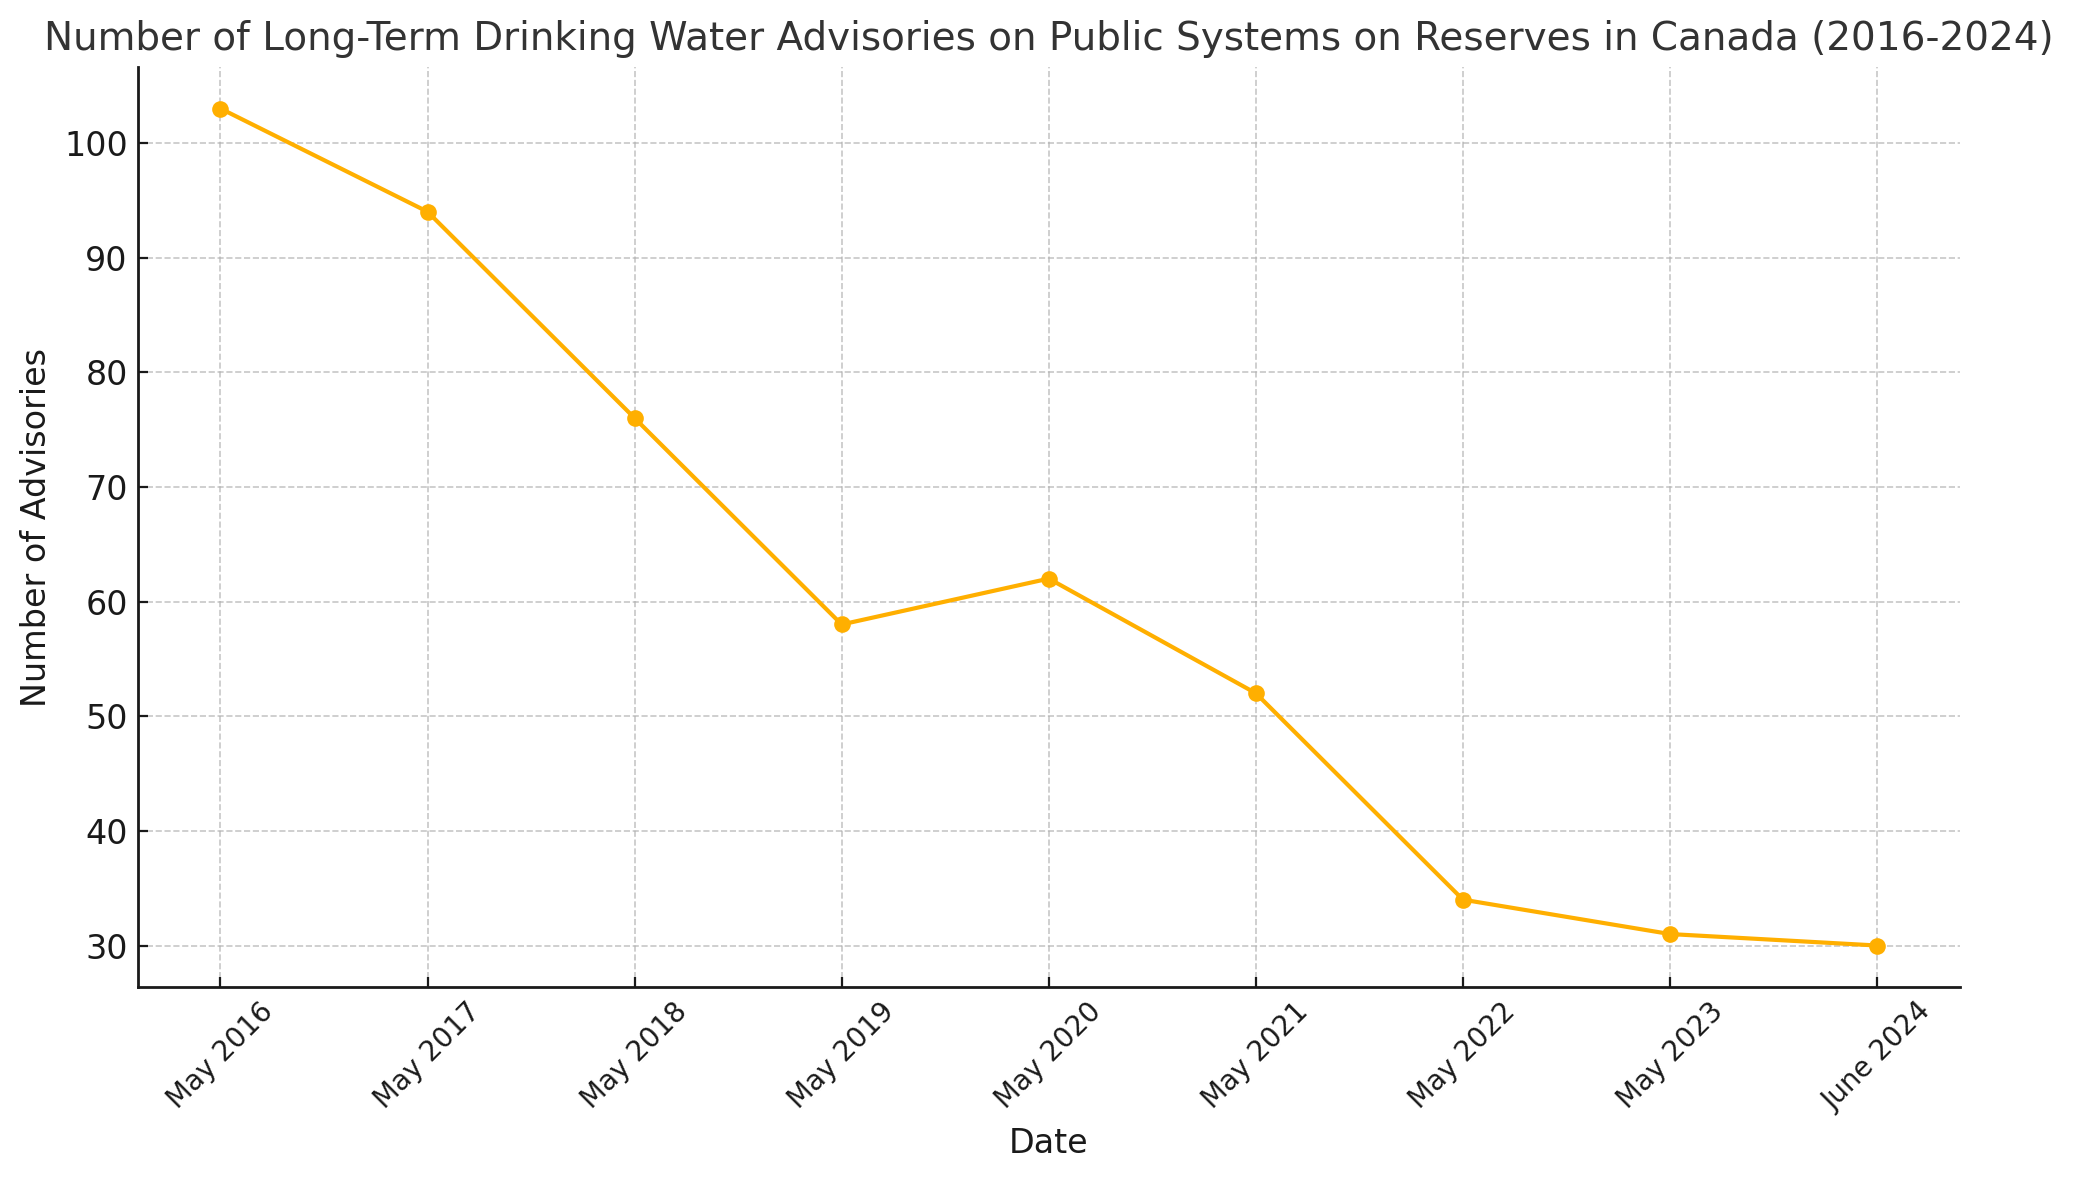
But progress seemed to stall in 2022. And in any case, 30 lingering long-term advisories is way too many.
Finally, a 2022 Statistics Canada publication reported that "Indigenous people have experienced long-standing health disparities compared to the non-Indigenous population" and that they suffered from "a higher prevalence of chronic conditions (e.g., asthma and diabetes) as well as disabilities compared to non-Indigenous people."
In other words, there’s certainly been visible progress in Indigenous affairs in recent years, but many serious problems remain. Given how more than ten percent of all government spending is directed to these files - while our Indigenous neighbours make up only five percent of the population - we have to wonder why they’re not catching up faster and where all that money is being spent.
You're treating "Indigenous" as synonymous with "First Nations" in some cases here. Each slice of federal spending is going to have a different denominator. For example, funding for the water advisories is used narrowly by First Nations reserve communities. But education funding would include the entire funding of the on-reserve K-12 system, and a post secondary program that provides some partial funding for some First Nations people who live on reserve, those who live elsewhere, and Métis and Inuit people.
The denominator also moves. There are many people identifying as Indigenous now who previously did not, and within the Indigenous population there's shifts between groups. Statcan has discussed this (https://www150.statcan.gc.ca/n1/pub/99-011-x/99-011-x2019002-eng.htm). But it mucks up any time series for, say, education or economic outcomes.
Even something simple like counting boil water advisories gets muddied quick, as it includes things like communities that have access to clean water but have kept the advisory in place until longer term issues are addressed or that have operational issues (https://sac-isc.gc.ca/eng/1614804984275/1614805007869, https://sac-isc.gc.ca/eng/1614716060696/1614716107587 for example)
Thanks for this. It's important to understand the results of this spending. We also need to scrutinize the methodology of the statistics. One of the unintended consequences of comparing indigenous populations and the general population is masking other factors that may contribute to outcomes. I suspect many of the outcomes attributed to indigenous people are shared by the rural poor who are lost in the general population figures. Can rural populations be, at least in a rough way, teased out of Stats Can's stats? The results might tell us more about how the indigenous spending is working and also show that there is, I suspect, another group of people who historically not been well served.