
Are Elections More Consequential Now Than a Generation Ago?

I think I’m not alone in feeling that choosing one political party over another carries existential importance. Check this circle on your ballot and the country will degenerate into a dysfunctional bankrupt authoritarian hellscape. Check the other circle and we’re the 51st state, future site of North America’s dumping ground for the bodies of executed journalists, political dissidents, and women.
Or something like that.
Polarization exists and it has a negative impact on social cohesion. But is it worse now than a half century back? Or is it that things always felt this raw, but that memories fade and the internet exaggerates modern conflicts?
I figured I’d try to find out by examining the election platforms for all Canadian general elections between 1974 and 2021. Did we used to argue about smaller things? Was the gap between left and right quite so gaping back when I was a lad?
It turns out that most of the hard work has already been done for us. The Manifesto Project maintains an ongoing comparative content analysis of policy positions from political parties in 67 countries - including Canada. That means the positions pushed over time by all of Canada’s major parties have mathematical representations, allowing us to measure whether or not we’ve been drifting further apart through the years.
This first chart gives us three different measures of the spread between the party with the most extreme left-leaning policies for each election and the party whose policies were the most right-leaning. The higher the result, the greater is the distance between the two extremes.
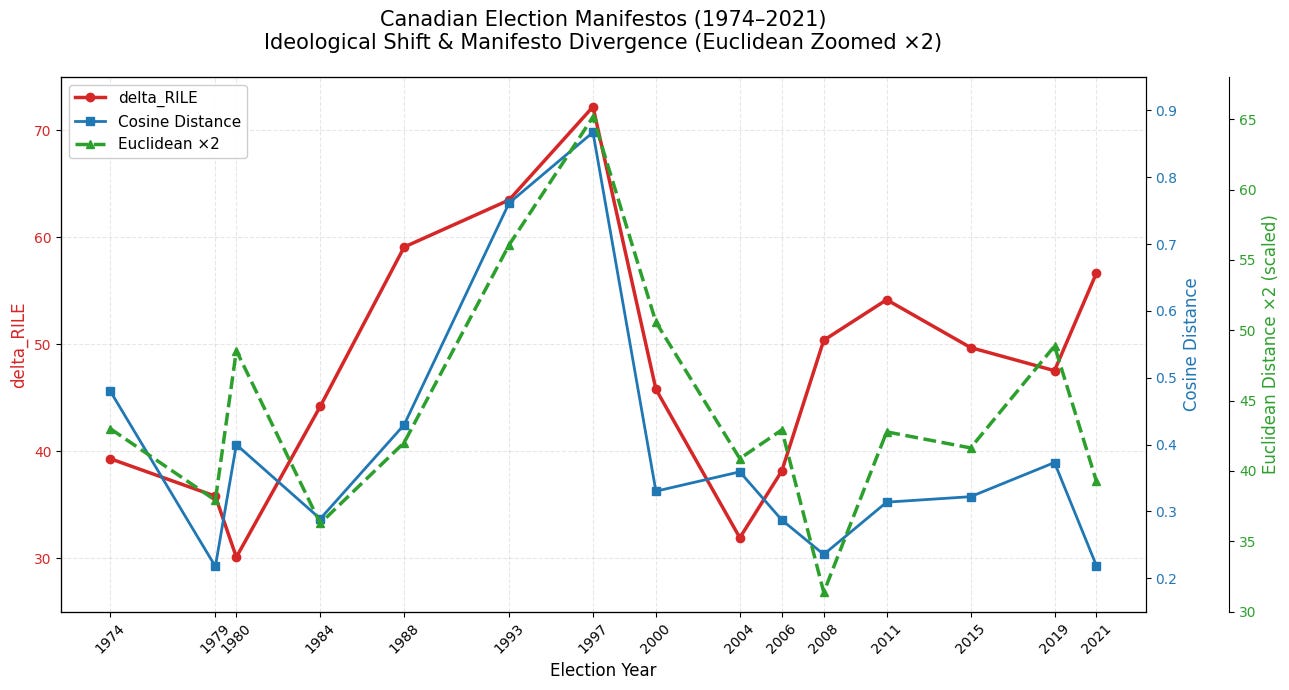
For the most part, the “left” was represented by the NDP and the “right” by either the Progressive Conservative or Conservative Party of Canada - depending on the year. There were two exceptions: 1997 saw a Reform party that offered policies that were considerably further right than were otherwise available. That’ll explain the sharp spike in the chart. And, interestingly, the 2015 Liberals found themselves to the left of the NDP.
The other visible anomaly in that chart is the divergence between the cosine distance and Euclidean distance - which both clearly declined after 2019 - and the delta RILE value which grew. Ok. I see I’m going to have to take step back to try to explain what those actually do for a living.
“RILE” is short for “right-left” and is a measure of the distance between the right and left ends of a country’s political ecosystem. Presenting a change in that measure as a “Delta” describes how far the winning manifesto has moved relative to the previous election’s victors. Presenting change as an absolute measure, by contrast, gives us a sense of how different manifestos are rather than which way they might have moved.
With that in mind, the absolute measures of difference fell post-2019, because all parties were spending their time talking about the same crisis issues. However, the delta RILE value climbed because the Liberals and Conservatives were offering wildly different solutions for those issues.
If all we had was that first dataset, we could safely conclude that we’re not really all that more polarized now than we were fifty years ago. But here’s another consideration. This next chart shows the size of the ideological spread between just the Liberal and Conservative parties:
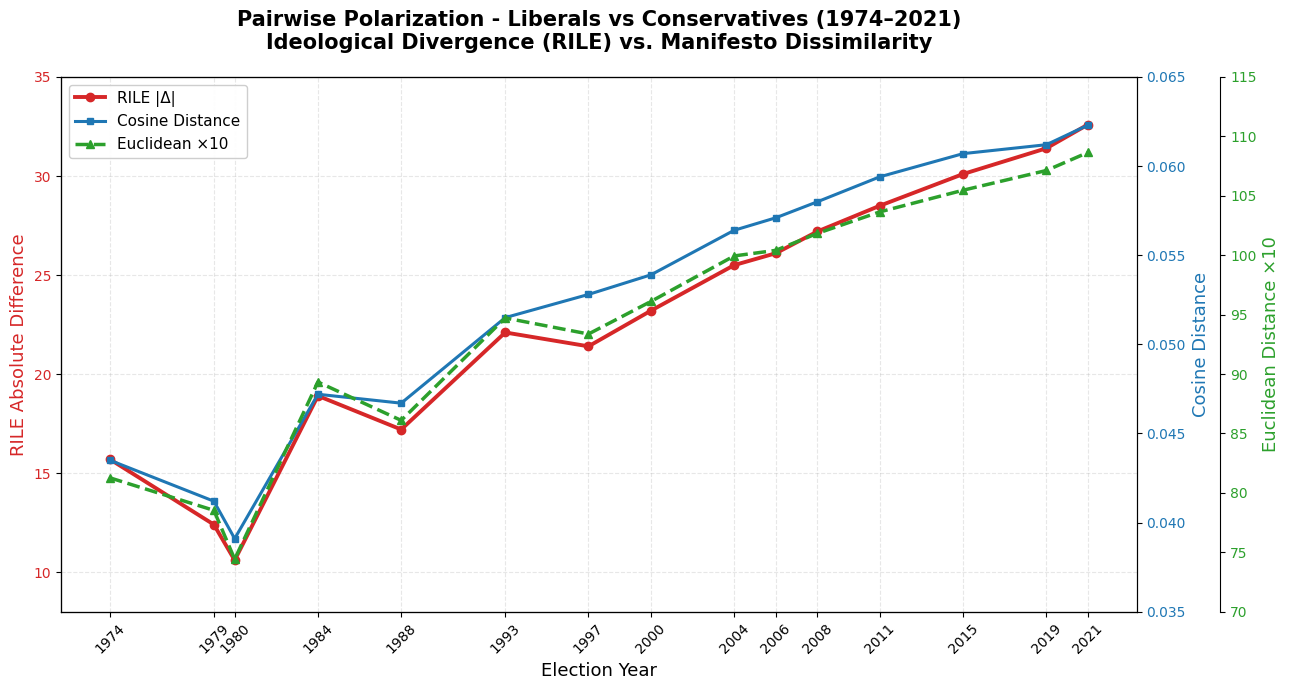
That demonstrates a pretty steady increase in the policy distance between the two largest parties. Given how those are the parties that attract most of the national conversation during (and after) election campaigns, it’s reasonable to infer that conversation is likely louder and less civil than it once was. After all, people on either side probably fear an electoral loss will lead to a greater disaster than a similar loss might have a generation or two earlier.
And they may be right.
These might also be interesting:
Do Government Spending Choices Follow Party Ideologies?

We probably all have built-in preconceptions for how our political parties will behave in office. For longstanding ideological reasons, Party A can be counted on to exercise fiscal responsibility, while Party B might be more likely to follow their devotion to a subset of social causes. We’ve been trained, in broad terms, to expect certain policy pattern…
Your Side of the Election Conversation

There was a satisfying flow of responses to my invitation to share your thoughts about what could earn your votes. All told, the text containing your ideas came in at around 15,000 words (or a 50-page book). Naturally, that’s way too much for me to build a reliable narrative out of the whole thing. So I asked my AI chum to go through the responses looki…
The widening divides between different political camps and the hollowing out of the middle ground has grown almost in perfect lockstep with the growth in internet and social media usage. Whereas a generation ago there was more or less consensus about most big things, the pivot away from consuming mainstream news media to getting our "news" from online echo chambers/rage factories has evolved our views on everything to us versus them. The public opinion bell curve has morphed into a horseshoe.
Interesting analysis – as always with your work. Thanks, for this.
It raises some questions. How did the analysts determine what was left or right? Was there an objective metric? Typically, most observers feel they're "centred" and measure others against their own subjective position. How did they map policies against the linear political spectrum: How did they decide if one policy proposal was left or right? And, how did they decide how much it was left or right? These tend to be subjective Interpretations. How did the analysts manage observer bias?
I should probably stop being lazy and look up the study myself!
Thanks for the thought-provoking post!