Do Government Spending Choices Follow Party Ideologies?
Using federal and provincial deficit data to fact-check political party identity
We probably all have built-in preconceptions for how our political parties will behave in office. For longstanding ideological reasons, Party A can be counted on to exercise fiscal responsibility, while Party B might be more likely to follow their devotion to a subset of social causes. We’ve been trained, in broad terms, to expect certain policy patterns among parties at both the federal and provincial levels.
But what if that was mostly election campaign talk? What if the way parties actually govern doesn’t reflect the preconceptions? A sharp-eyed subscriber to The Audit recently reached out to me with the suggestion that the answers to those questions might not always meet our expectations. And he was correct.
The truth is that I’ve already written about tracking individual policy initiatives by comparing the real-world results of Stephen Harper's 2011 budget promises with what came out of Justin Trudeau's 2016 budget. But now I’m going to try to visualize big-picture spending habits along party lines. In other words, how did Liberal, Conservative, and NDP governments behave when they were in charge at either the federal or provincial level?
To get the data I needed, I turned to Statistics Canada. Specifically, their statement of government operations and balance sheet, government finance statistics, and their Canadian government finance statistics for the provincial and territorial governments datasets.
In this post, we’ll look specifically at budget deficits. Those are created when governments decide to spend more in a given year than the amount of cash actually available to them. The deficit amount is added to any debt accumulated from previous years which, besides being payable at set future dates, will also generate debt servicing charges (i.e., interest payments). The larger our debt, the greater proportion of our budget will be diverted away from programs in favor of interest payments.
Contrary to common misconception, public debt can’t be carried indefinitely. Some three quarters of our government’s debt is in the form of either short term and long term bonds that come with hard maturity (pay-back) deadlines. Defaulting on such securities would be devastating for Canada’s credibility and for its economy.
So I think it’s reasonable to expect governments to take these issues seriously. Sadly, the graph below shows us that there hasn’t been a year since 2008 when we didn’t add to the debt. In fact, there haven’t been consecutive years of positive operating balances since the period between 2000 and 2007.
I should note that, for simplicity, I included only results from the first fiscal quarter of each year which could partially skew results.
But surprisingly, both the Conservatives (2008-2015) and Liberals (2015-present) seemed to have been equally irresponsible:
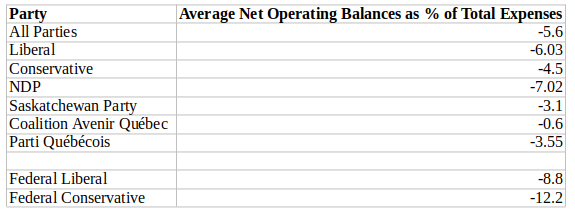
That graph uses federal net operating balances and plots them as a percentage of the total expenses for that year. This serves to normalize the numbers so anomalous economic events won’t distort the results.
The gigantic 25 percent deficit in 2010 was mostly the result of the Harper government’s response to the global financial crisis that begin in 2008. The combination of stimulus spending with tax cuts were the primary drivers of the deficit peak. However, true-to-form, the Conservatives were clearly busy dragging spending back down when they were voted out of office in 2015.
The Trudeau Liberals were also hit by their own (COVID-driven) crisis. Subsequently, their deficit percentage is also dropping. While it doesn’t show up in the graph, the Q1 2024 number is only 3.5 percent, which is a significant drop from 2022.
Note that, for the all the representations in this post, I omitted data from years involving a transition between governing parties at both the federal and provincial levels. This avoids “blaming” one party for the policy choices of the other.
Now let’s see how our deficit percentage measure plays out across provincial governments. The next table will more or less conform to expectations. The Conservative parties (which, for convenience, includes the federal Conservative party, along with various Progressive Conservative parties and Alberta’s United Conservative party), along with the Saskatchewan Party and Coalition Avenir Québec have relatively low rates (-0.6 to -4.5 percent). Liberal and NDP governments allowed more spending.
As you can see, both federal parties have higher rates. This reflects the nature of Canadian federalism, where the federal government picks up a lot of provincial spending slack through transfer payments. But, averaged over time, the Conservatives did add to the debt at the highest rates.
Another way of understanding spending patterns is how much money governments devote each year to debt servicing.
Not so fun fact: approximately 6.8 percent of the average Toronto resident’s tax bill (when considering federal, provincial, and municipal taxes) will be spent on servicing government debt.
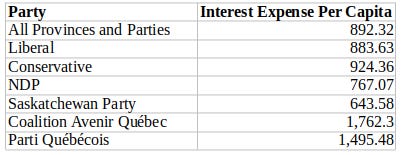
Of course in some cases a government might be paying off debt that was incurred by its predecessor. But since there have been more than a few parties who enjoyed many years in power - and since, as before, I’m not incorporating transition-year data in my calculations - this table of per capita interest expenses (using 2022 provincial population numbers) should be useful:
There are two particularly interesting things happening here. The first is that various flavors of Conservative governments are facing higher annual per capita debt financing costs ($924.36).
And the second is that interest payments by the two Quebec-only parties (PQ and CAQ) tower over the rest of the country. But compare that with those parties’ low deficit percentages that we saw above (-0.6 and -3.55). There’s something odd going on here.
That mismatch might be at least partly the fault of deficits run up by the provincial Liberal party who preceded both of them in power. There were nine years of Liberal rule before the PQ’s brief 2012-2014 term, and the Liberals ruled again from 2014 to 2018 before the CAQ came to power.
In fact, the period between 2008 and 2013 did indeed see Quebec government deficits averaging around $3 billion each year. Between 2014 and the expensive response to COVID kicked in, Quebec ran budget surpluses in the $3.8 billion range. Perhaps the PQ and CAQ were simply doing the best they could in a tough situation.
But the bottom line here is that accumulating new debt is a vice that’s popular among governments of all stripes. It’s certainly possible that party communications teams are consciously misleading us, election campaign after election campaign. But my money’s on a narrative involving unrealistic economic plans getting mugged by reality - over and over again.


Thanks for the analysis. I appreciate you crunching the numbers so I don’t have to.
One thing you didn’t mention is that interest rates were close to 0 for much of the 2010s. So, there’s little cost in going into deficit. I expect things will be quite different going forward and higher than interest rates will be (or should be) a disincentive to more excessive borrowing.
All electable parties in Canada support the welfare/nanny state and their own delusions in their abilities to manage leviathan. Where they differ is in their incentives / disincentives to grow the economy and in their levels of exuberance in buying off the marginal voter. Your data did confirm Harper's efforts at bringing down the deficit to close to zero by the time the media had finally helped replace him with a return to the Trudeau dynasty and requisite spending increases.