
Is Your Government's Social Policy Missing Something? The Myth of Permanent Poverty

Carefully defining poverty is essential for figuring out who should be targeted with finite social support resources. But it’s just as important to understand how poverty moves through time and across population groups.
This point was nicely illustrated in a recent post by the ever-insightful writer who, for some reason, goes by the name Cremieux Recueil. Cremieux argued that only a tiny proportion of Americans are born poor and remain poor for entire entire lifetimes. Instead, poverty in the U.S. is largely the product of your age. Young people at the start of their careers and the elderly who live with diminishing income are the most likely to be poor. In particular:
“If we followed the people who were below the poverty line in 2007, 2009, 2011, or 2013 through 2018, we’d see that within two years, most of them are already out of poverty. 10 years on, three-quarters of them are no longer below the poverty line!”
I’d like to see how this trend translates to Canada. Unfortunately I don’t have access to quite the same level of age-controlled income data as exists in the U.S., but I think there’s enough available to pick up larger trends.
I began with the Statistics Canada “Tax filers and dependants with income by total income” table. That allowed me to track people over time within ten-year age cohorts (25-34, 35-44...) by income bins ($5,000 and over, $10,000 and over…). The nice thing about that data source is that the income amounts include government support and benefits.
I used Statistics Canada’s official Market Basket Measure (MBM) thresholds to define poverty. The MBM is a measure of the costs of basic goods like food, clothing, and shelter. We’re going to face two problems with this threshold:
Statistics Canada doesn’t publish a single MBM “poverty line” number for each year. Instead, they publish numbers reflecting true costs for individual geographic regions.
The MBM is published for “reference families” rather than individuals. The income data we’re using, on the other hand, represents all individual tax filers.
I’ll accommodate those issues, first, by going with the metropolitan Toronto MBM numbers which are more or less the highest in the Country. This will give us the most “generous” definition of poverty possible. For reference the “Newfoundland and Labrador, rural” MBM is generally around 12 percent lower than the one used for Toronto.
To give us thresholds that make sense for individuals rather than families, I’ll set our level at 60 percent of each year’s official MBM family numbers.
The following chart represents a longitudinal tracking of Canadians grouped by age over time. That is to say, I tracked the total average income of each age cohort over 10 and (where numbers were available) 20 years.
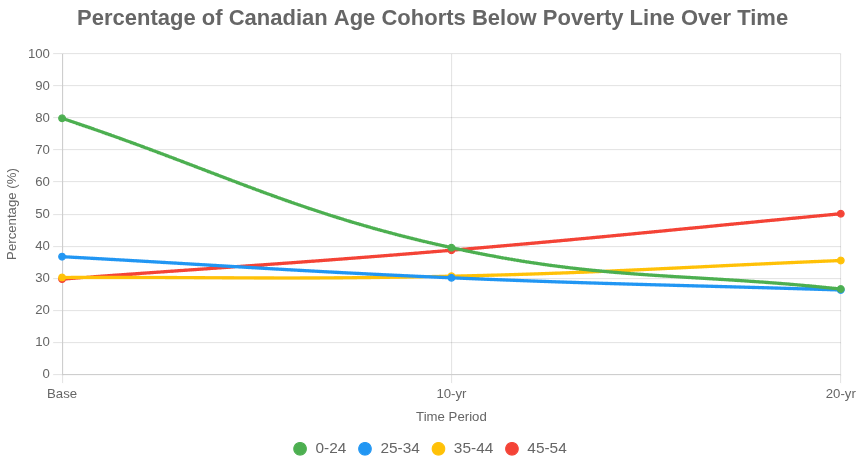
You can easily see that the share of the population of 0-24 year-olds living below the MBM drops by around 60 percent over 20 years while poverty levels climb for 45-54 year-olds as they move towards retirement.
This is easy enough understand. Tax filers younger than 24 years of age are obviously going to be earning less: they’re still at the start of their careers and are likely either living with their parents or being supported in school. At the ten year mark, half of them have climbed out of “poverty”.
In fact, this is something government policy seems to have largely misunderstood. When they were still teenagers, my own kids began filing taxes and found themselves automatically enrolled in “poverty reduction” programs that, in our family context, made precious little sense.
Of course, the MBM isn’t the only way to define poverty. OECD numbers, for example, set Canada’s overall poverty rate in 2023 at 12.2 percent when measured in the context of 50 percent of the national median disposable income. But - as with Statistics Canada’s MBM - that OECD figure is a metric that’s relevant only within Canada.
And that certainly makes sense. An individual in Toronto earning $34,519 (the 2023 MBM threshold) is certainly not swimming in wealth. Worrying about making the next rent payment and affording food is no small thing, and I’m sure most of us would be happy for our tax dollars to be spent easing that pain.
But it’s the finer trends and nuances of street-level poverty that should be better understood if we want to shape a truly compassionate and truly effective public safety net.
Here are some related posts that might interest you:
The Problem With Personal Income Tax Rates

A short while back I wrote about the Problem of Corporate Tax Rates. That’s where I presented data strongly suggesting that higher provincial corporate tax rates are likely to produce negative economic and social outcomes.
Does Income Inequality Matter?

Reducing poverty and its harms is among the most urgent responsibilities of any modern government. But despite the claims of some activists, this particular problem has no obvious and easy solution. I’m going to suggest that targeting income inequality in particular is a waste of time.
As always, Sir, your explanations of complex issues are proof that ..... those issues are complex.
If only our politicians would consider complexity and abandon their incredibly simplistic bromides and predictably unoriginal pap. And, I say that about ALL politicians not simply those of any particular party.