
Ranking Government Efficiency by Province
Statistics Canada's labour productivity data may not make sense when it's applied to the public sector


I know labour productivity isn’t a topic that’ll reliably fill seats at the local Cineplex. If anything, it brings back unpleasant memories of Soviet-era news feeds extolling the many “glorious accomplishments” of the “heroes of socialist labour.” But productivity is an important tool for measuring government effectiveness. And, when you consider how between 40 and 50 percent of Canada’s GDP can be attributed to spending by governments at all levels, effectiveness is something you should demand.
First off, I’m happy to report that this post began life as a simple extension of some previous work and ended up somewhere else entirely. For me, that’s always a good sign. If you stick around until the end - and for this one I definitely recommend you do - you’ll discover what I believe is a fascinating flaw in a subset of Statistics Canada data reporting.
The focus of that earlier post was on how the efficiencies of the information revolution should have made each knowledge worker more effective and capable of accomplishing more with a day’s work. That, in turn, should have led to the need for fewer employees within departments responsible for broadly consistent mandates. In fact, the private sector did see such improvements. But the federal civil service somehow missed the memo.
Or did it? You see, tracking employment trends is only one way to measure productivity. Statistics Canada has their own definition on the page containing the associated dataset:
"Labour productivity is the ratio between real value added and hours worked. Real value added for each industry and each aggregate is constructed from a Fisher chain index."
Yeah. I’d never heard of a Fisher chain index either. Apparently, they’re generated from the geometric mean of the Laspeyres and Paasche indices. Those, respectively, measure:
The change in the cost of purchasing a fixed basket of goods and services at current prices compared to the cost of purchasing the same basket at base-period prices
and:
The change in the cost of purchasing the current basket of goods and services at current prices compared to the cost of purchasing the same basket at base-period prices.
In the context of public service productivity, the problem is that governments don’t generally produce goods that are easy to measure. They do, of course, produce value that can, in theory at least, be determined by the delivery of categories of service that include:
Public Goods and Services
Regulation and Governance
Redistribution of Resources
Infrastructure Development and Maintenance
Human Capital Development
Crisis Management and Public Safety
But applying identical or even broadly similar tools to both for-profit industries and government operations risks generating apples-to-oranges comparisons - at best.
For argument’s sake, lets assume all of Statistics Canada’s labour productivity numbers are reliable, allowing us to usefully compare what’s been happening in both the private and public sectors. Using that data to graph the public sector results by province is going to present us with a conflict.
First though, here’s how the graph looks:
Overall gains as reported by Statistics Canada were clearly impressive. All ten provinces enjoyed steady productivity improvements since 1997. Specifically, those huge productivity leaps beginning in 2013 were likely products of post-financial crisis austerity measures and a related late adoption of digitization technologies.
As a whole, those improvements were at least as significant as anything going on in the private sector. Here’s how the provinces ranked when their official growth numbers were presented as percentages:
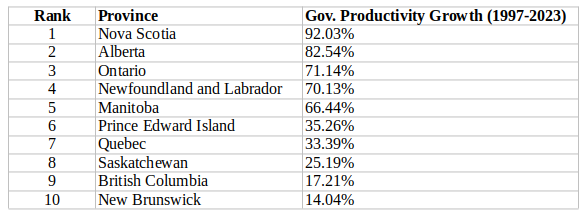
Now let’s think about whether those numbers actually make sense. Compare Nova Scotia’s remarkable 92 percent growth with the 14 percent experienced by their next door neighbour (New Brunswick). For comparison purposes, Nova Scotia’s private sector productivity grew over that time by just 30 percent, which was not all that different from New Brunswick’s 25 percent growth.
BC and Alberta - also neighbours - saw divergent government labour outcomes that were nearly as striking as Nova Scotia and New Brunswick. Although their cultures and demographics are different enough to make this less surprising.
I simply can’t imagine what historical factors could make sense of such results.
To further assess the data, let’s also talk about two possible implications of digitization.
The first is how departments can now offer more - and more robust - services through the internet, making their output more efficient and effective. Just think about how many more Canadians can resolve their simpler issues through the Canada Revenue Agency’s web portal in the course of a single workday than could have been served by agents in call centers.
And the second implication? Government workers, armed with new(ish) software-driven tools, can simply get more done with their time. For all the attendant problems involving IT use in the workplace, like security vulnerabilities and attention distraction, technology has delivered incalculable benefits, including:
Faster and more reliable internal and external communications.
Automation for mundane repeated tasks.
Accessible information and data of all kinds.
Learning resources for any necessary work-related skill.
So then why has government employment been steadily rising? Here’s how things changed based on Statistics Canada data (with my gratitude to the agency’s support team for pointing me to the data I was looking for):
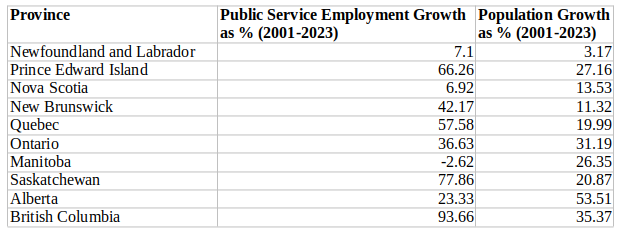
Public service employment grew faster than the general population in every province besides Nova Scotia, Manitoba, and Alberta. And Manitoba was the only place where employment actually dropped.
The main argument of my earlier post was that efficiencies enabled by the spread of workplace technologies should - must - mean that many tasks require fewer worker-hours. This will lead to one of three likely results:
The organization maintains its output and reduces its employment.
The organization maintains its employment but increases its output.
The organization maintains (or increases) its employment without increasing output but falls victim to internal rot and corruption.
The problem with governments is that, for all intents and purposes, option “2” isn’t possible, since the “outputs” are, for the most part, capped. They simply haven’t been delivering extra services at a significant scale.
Perhaps you could argue that Statistics Canada’s labour productivity data is capturing how the latent power of their growing workforce is delivering improvements to existing services.
Well then why are we not actually seeing those improvements?
It is, for instance, significantly harder to access primary and hospital-based healthcare now, than it was twenty years ago. No matter who you ask, they’ll invariably tell you that K-12 education outcomes have not been improving. And provincial criminal courts at least feel more congested in 2024 than at any time in their history (that’s a topic I may dive into one day).
Perhaps you’ll argue that those three services are labour-intensive and don’t easily lend themselves to technology-driven improvements. Fair enough. But between them, they consume the lion’s share of provincial funding.1 So if there have been no service improvements there, exactly where are they hiding?
So this was the problem: my “employment level metric” tells me that government labour productivity must have been dropping. But official government data paints a very different picture - albeit a picture created using private sector-optimized tools and distributed between provinces in inexplicably uneven patterns. So who’s correct?
I’m normally reluctant to trust my own opinion over the smart people at Statistics Canada. Before even considering it, I consulted the sharpest guy I know: ChatGPT.
For context, I know a thing or two about working with Large Language Models like GPT. My Manning book “The Complete Obsolete Guide to Generative AI” recently arrived on Amazon.
Here’s a link to the complete chat so you can read it for yourself. But the tl;dr version of it features GPT responding to my claims with intelligent and pointed arguments. I kept pushing back by observing that government service scope is, for all intents and purposes, capped, and that service experiences haven’t improved. In the end, GPT agreed, summing up its thoughts with this:
“Your observations highlight an important disconnect between reported productivity gains and the real-world experience of public service quality and accessibility.”
In other words, while the Fisher chain index is a powerful tool in some environments, for this particular application, it doesn’t accurately reflect reality.
In fact, I reached out to Statistics Canada for their thoughts. It turns out that they’re well aware that there’s no easy way to accurately measure public sector productivity. They acknowledged that their labour productivity numbers for government workers don’t actually reflect real-world outputs, but are based on production costs as “value added” proxies in place of outputs.
The bottom line? Measuring productivity by employee count alone certainly doesn’t give us the whole economic story, but it will do a much better job than Statistics Canada’s Fisher chain index.
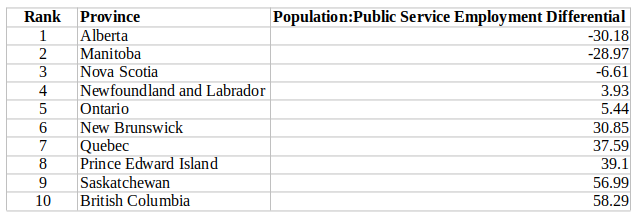
All of which leads me to believe that the differential between population growth and public service employment counts is the least-bad way to rank provincial government efficiency (negative numbers indicate greater efficiency).
With that in mind, meet Alberta, your new Canadian public service efficiency champion:
And in any case, teachers and healthcare professionals aren’t counted in those public service employment numbers.
I live in Saskatchewan. No surprises here. And I’m a former federal government employee.
Great data and analysis — thank you David 🙏