Government Productivity After Four Decades of Information Revolution
Why isn't government getting better at delivering services?
Beginning with the previous post I’ve begun experimenting with adding AI-generated voiceovers for those of you who prefer audio. Please do let me know whether you love the idea or hate it - or whether you couldn’t stop laughing right the way through. (Just wait ‘till you hear how it pronounces “Shawinigan”.)
If you’d never set foot in an actual office, you’d probably expect more workers to produce more output. “Many hands make light work” and all that. But in the real world things don’t always work that way. Especially in the public sector. Here’s where we try to measure the fraught relationship between government bloat and productivity.
Just how bloated is our federal government and is the bloat getting worse? At least from the perspective of employment levels, the government itself provides us with plenty of good data.
The actual proportion of federal employees to Canada’s total population has been noticeably growing over the past five years. Because of the scale I chose for its y-axis, the graph below does exaggerate the changes a bit, but you can see how the federal workforce grew from around 0.72% of the total population in 2017 to 0.9% in 2023. That means about one out of every 59 employed Canadians now works for the federal government.
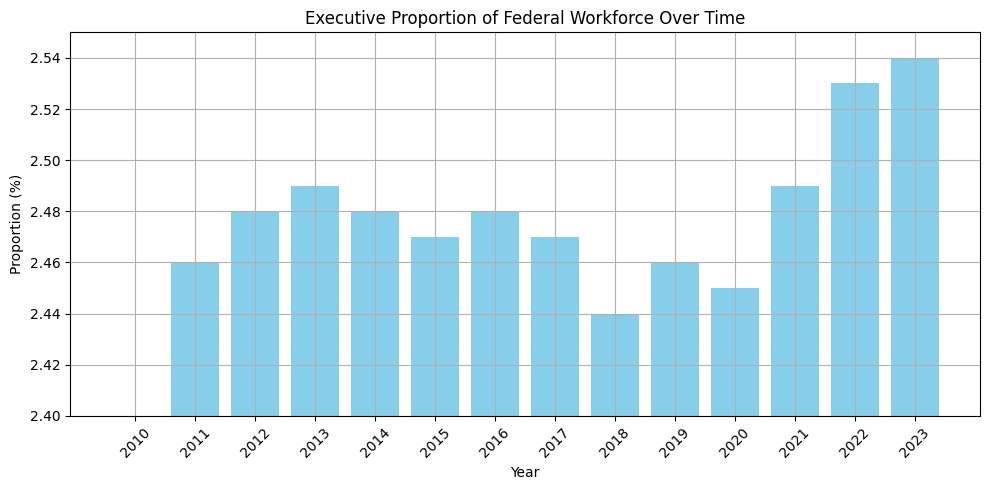
Over most of those same years, the proportion of executives (at all levels, from EX-01 to EX-05) to non-executives has also grown from its 2018 low of 2.44%, to 2.55% in 2023. Such changes will obviously drive up salary expenses, but they also risk sacrificing actual productivity for “process management busywork”.
Some might argue that a larger government workforce is necessary for expanding and improving government services. But in a world where automation and artificial intelligence are supposed to be making everything more efficient, should that be true?
How can we measure worker efficiency? When it comes to large economies, one popular approach is to track labor productivity - a measure of real gross domestic product per hour worked. Predictably, Statistics Canada publishes a labor productivity index where the 2017 value is set to “100” and the performance of all other years is measured against 2017.
As you can see from the graph below, the greatest improvements in the Canadian economy’s labor productivity took place between 1994 and 2014 - which just happened to have more or less been the years of highest software and networked systems adoption. (The graph conveniently skips 2020, when COVID lockdowns turned everything upside down.)
So efficiency in Canada’s general economy rose consistently. How did the government do through that same period? Labor productivity in government can be a bit harder to measure. After all, it’s not like they produce a physical product or sell services directly to customers.
The best way I can come up with to rate government worker productivity is through the size of the workforce. That is, government provides a set of services that doesn’t change dramatically from year to year. Sure, as the population grows they’ll need to process more passport applications and oversee the movement of greater numbers of international travelers across our borders. But task complexity shouldn’t increase faster than the population itself.


