
What's Driving the Rising Cost of Canadian University Education?
And guess who's paying for it

We’ve probably all seen reports describing out-of-control higher education costs in the US. An education that in the 1970’s could be paid for with some savings and a part time job at the local Burger King will now cost you the equivalent of a down payment on a multi-family investment property. I’m not exaggerating. Check it out for yourself.
Those increases are not just the result of regular inflation. When you track US college costs against consumer goods (as the economist Mark J. Perry did here), you’ll see that rising college-related expenses are unlike anything else (besides healthcare).
What changed? The word on the street is that those crazy tuition costs are mostly due to colleges hiring armies of non-teaching administrators.
That’s what’s going on below the 49th. But what about Canadian universities? Back in 2006-7, according to Statistics Canada, across all Canadian universities the average inflation-adjusted cost of one year’s undergraduate tuition was $17,363. Fast forward to 2023-2024 - just seventeen years on - and that same tuition-only cost has now doubled to $34,628.
Note how I referred to those numbers as “costs”. That’s because $34,628 is what you’ll pay if you’re an international student without scholarships. Thanks to government subsidies, Canadians get a big discount. In fact, domestic students currently pay only $6,434. But it’s taxpayers who cover the difference.
So tuition is rising far faster than inflation. But is there any way to estimate what it is that’s driving those increases? Yup.
The rise of the university administrator
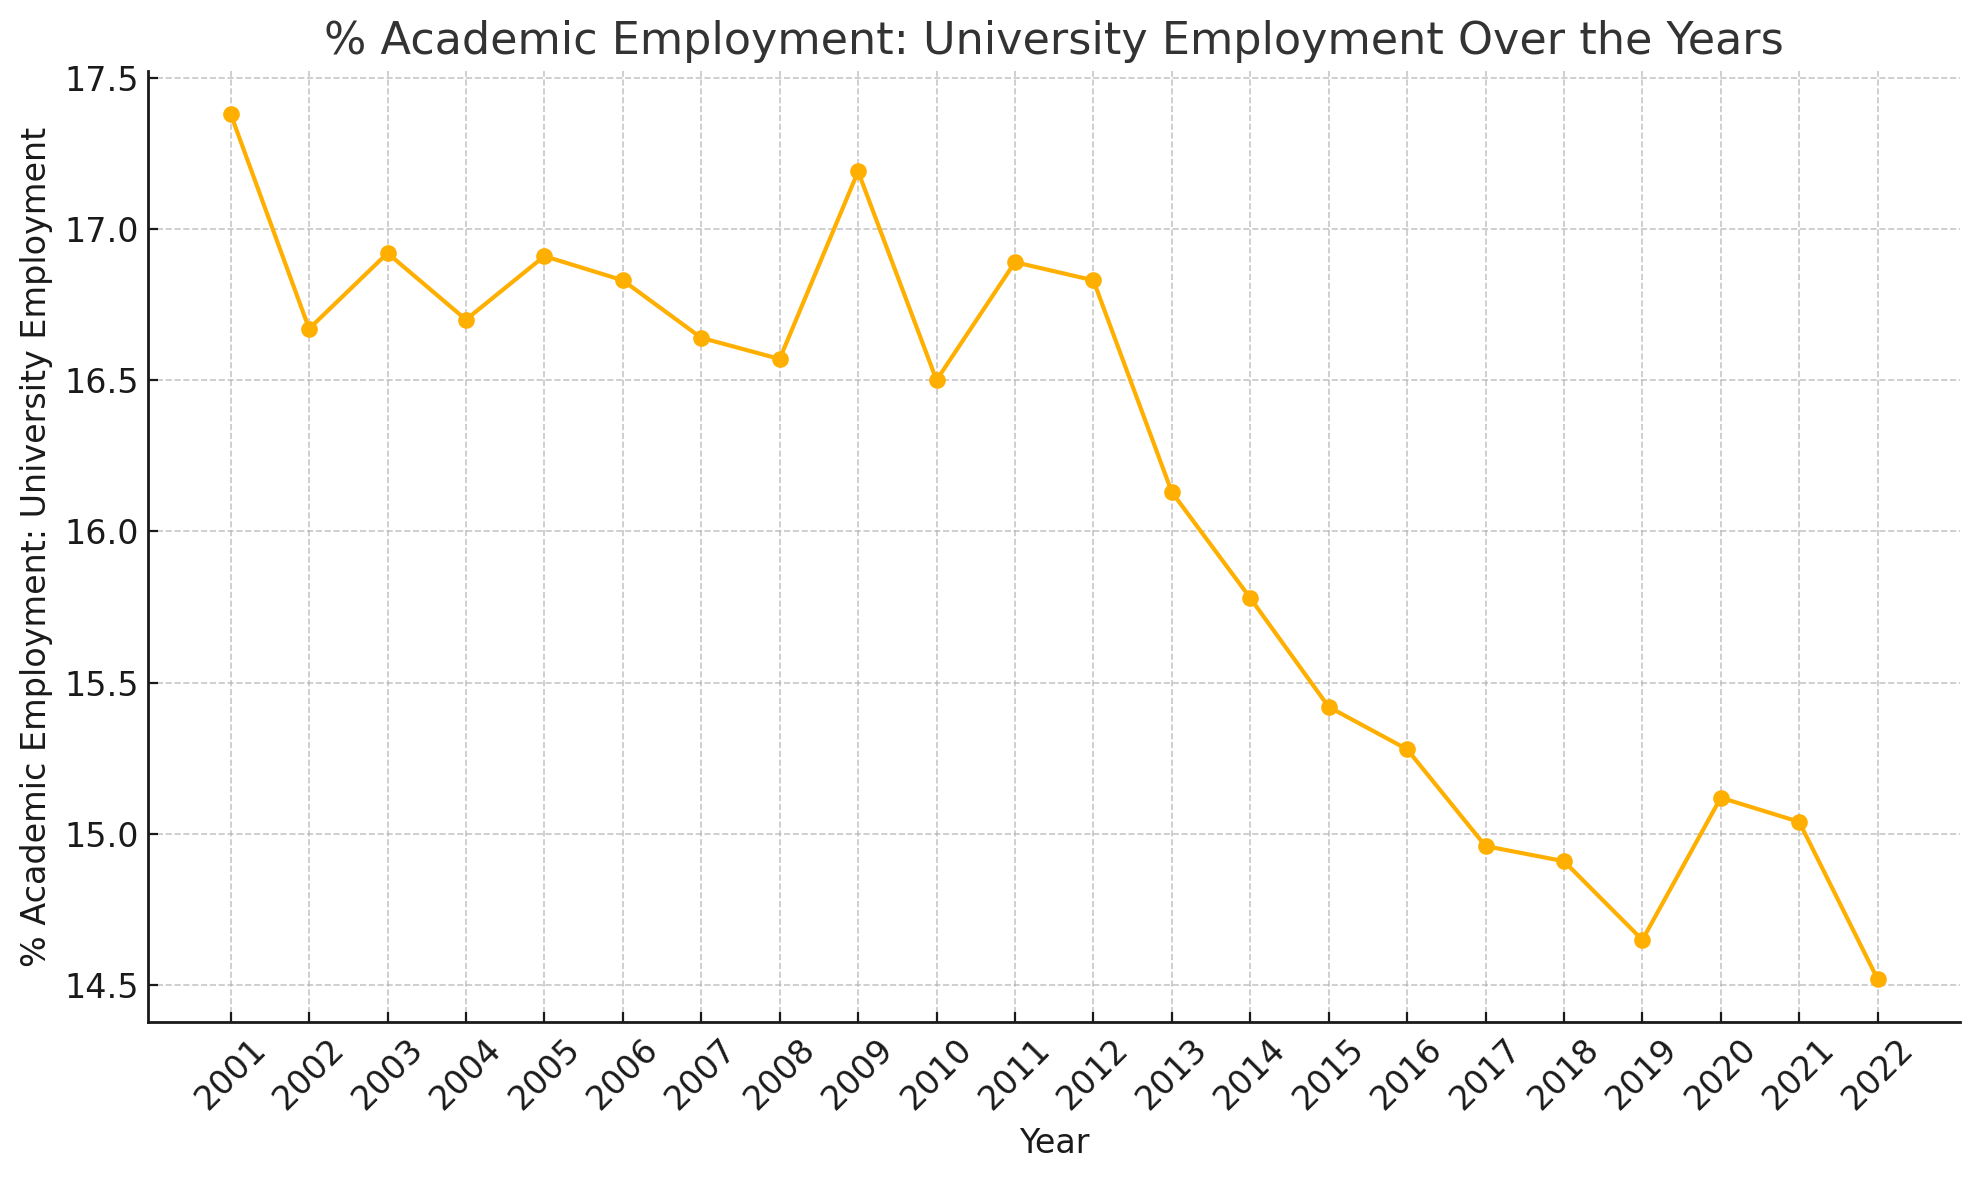
As the chart shows, since 2001, teaching jobs have dropped from accounting for 17.38% of all university positions down to 14.52% in 2022. In other words, universities are, proportionally, hiring teaching staff at significantly lower rates than they used to.
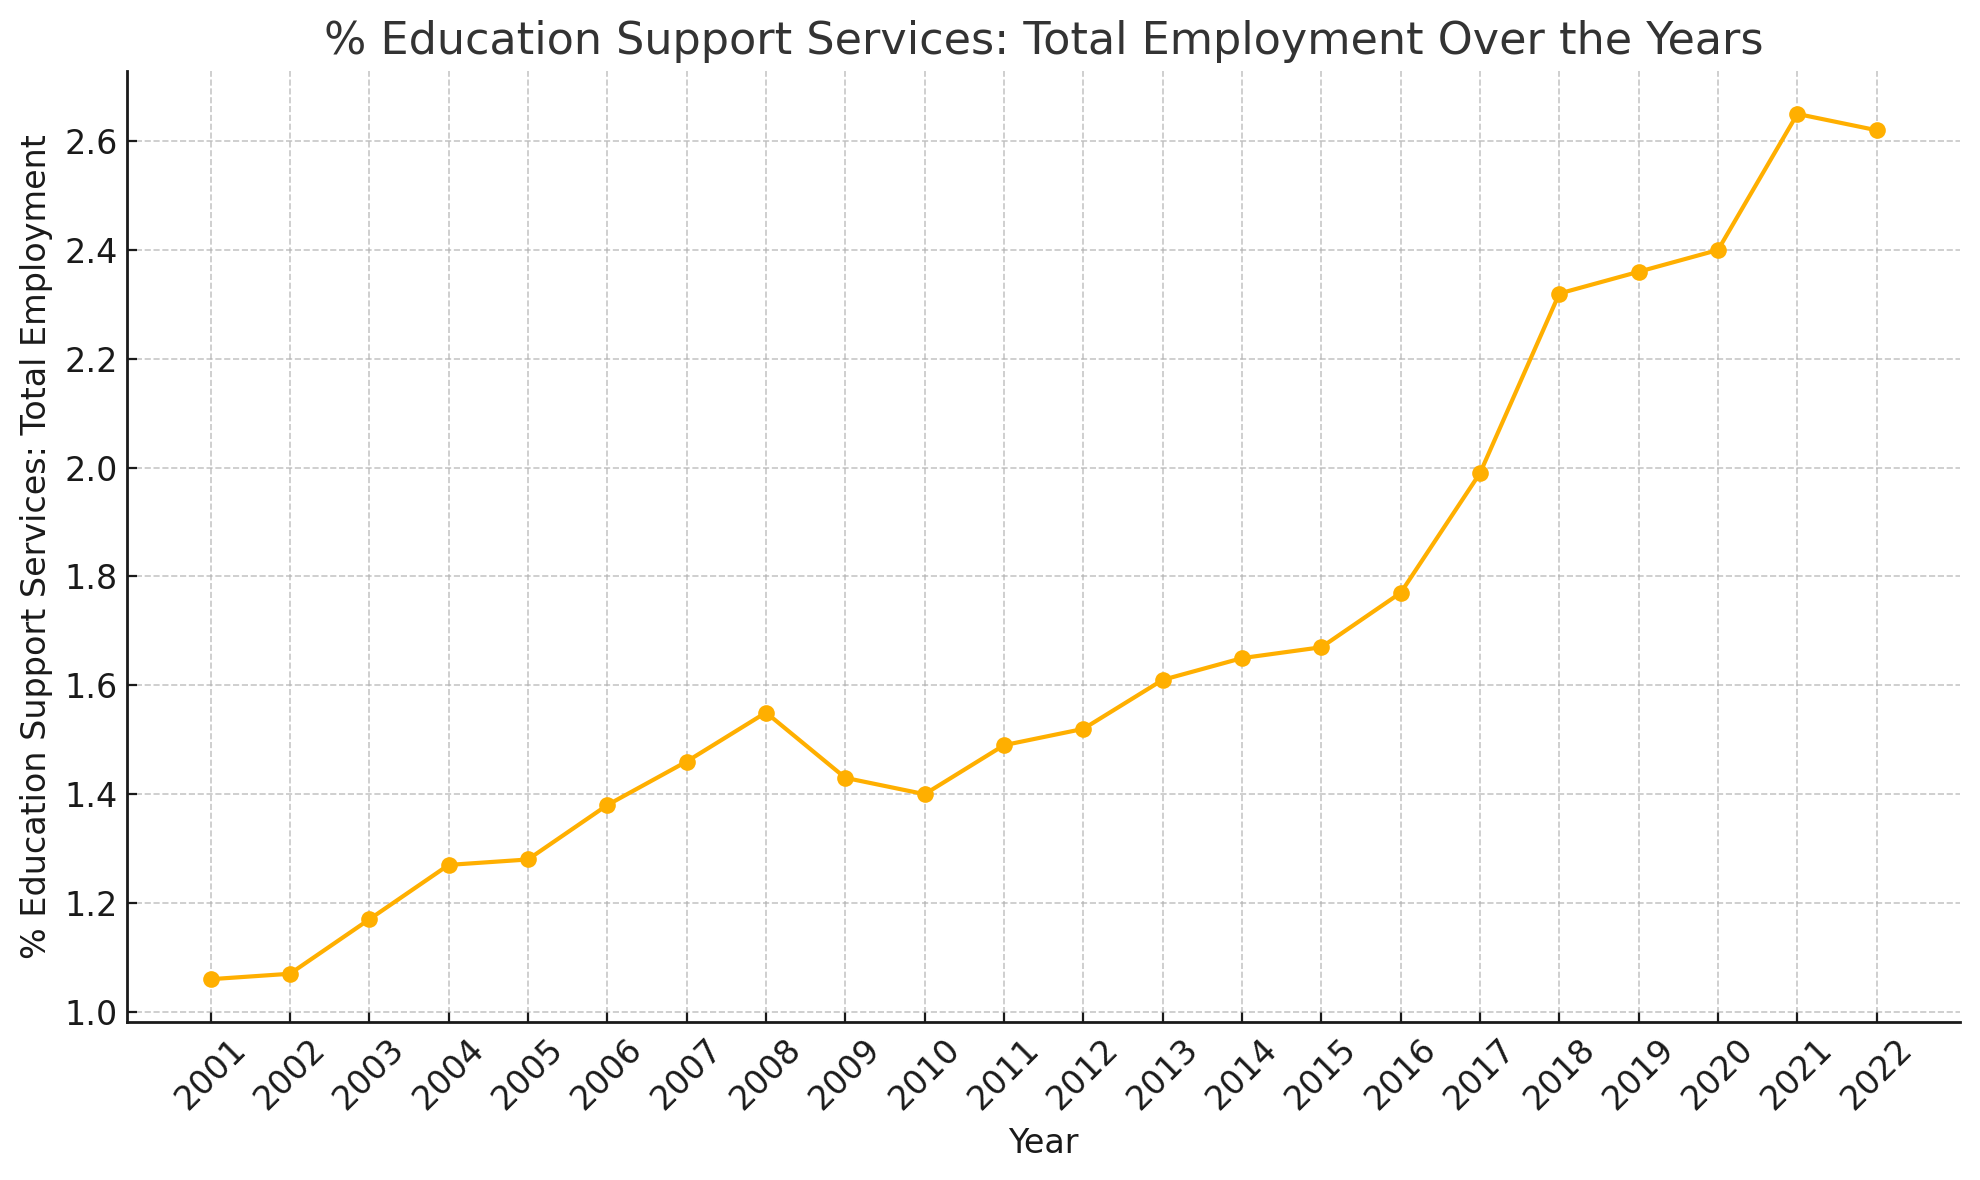
However, those numbers don’t tell us who universities are hiring instead of teaching staff. Perhaps they’re building up their food services, security, and custodial crews. There is at least one identifiable subgroup that’s visibly ballooned: education support services. That North American Industry Classification System category (NAICS 6117) includes educational consultants, student exchange program coordinators, testing services, research and development, guidance counselors, and tutoring and exam preparation services.
Since 2001, the proportion of support services staff in relation to all hires has more than doubled, from 1.06% to 2.62%. Their absolute numbers across Canada rose from 3,829 to 15,292 - that’s a jump of 400%.
All of which suggests that the problems attracting so much attention in the US are very much part of the higher education ecosystem here in Canada. The big difference, though, is that Canadian taxpayers are expected to pay for a far greater proportion of the product.
That’s certainly an interesting trend. But an increase of just 1.5 percent isn’t enough to explain the tuition growth we’ve experienced. And I’m also not sure that the “education support services” category maps directly to the class of high-earning administrator they’re talking about in the US. It looks like we could use some more data.
Tracking Salary Changes in Ontario Universities
The year 1996 saw a welcome victory for government transparency when Ontario’s then-Progressive Conservative Premier Mike Harris mandated the annual disclosure of all public sector employees earning more than $100,000. Since that year, the Sunshine List, as it’s popularly known, has grown from just 4,500 names to more than 300,000. However, $100,000 won’t buy you what it once did – especially if you must live in Toronto.
Perhaps we could bring those numbers up to date. Using the Bank of Canada’s inflation calculator, I identified the inflation-adjusted value of 100,000 1996 dollars for 2003 and for 2023. I then identified the individuals on the list who were employed by universities in 2003 and in 2023 and whose salaries were above the inflation-adjusted thresholds. The new thresholds, by the way, were $117,000 for 2003 and $175,000 in 2023.
The first thing that hits you when you see the adjusted data is the explosive growth in hiring. Ontario universities (not including colleges) employed 2,191 individuals earning more than $117,000 in 2003. Twenty years later, the number of employees earning more than $175,000 had ballooned to 8,536. That’s 290 percent growth. The number of people with “dean” in their job description climbed from 195 to 488 during those years. And there are now 6,772 professors on the high earners’ list as opposed to just 1,782 back in 2003.
For context, Statistics Canada tells us that there were 397,776 students enrolled in Ontario universities in 2003 and 579,057 in 2022 (the latest year for which data is available). That’s an increase of 46 percent – which doesn’t justify the 60 percent jump we’ve seen in high-paid deans and the 74 percent increase in similarly high-paid professors.
I think things are starting to come into focus.
Now let’s find out what happened to salaries. Did you know that there’s a strategic management professor who’s earning more than $650,000 annually? And what about that hybrid dean/lecturer who’s pulling in close to $600,000?
Okay… those are probably outliers, and there isn’t much we can learn from them. However, I can tell you that the average university employee in our Sunshine List earned $140,660 back in 2003. Twenty years later, the inflation-adjusted equivalent of that salary would be $211,887. But in the real world – the one that those on the public payroll graciously agree to share with us – the average 2023 university employee on the list earned $220,404. That’s a difference of only 4 percent or so, but that’s after we already accounted for inflation.
Perhaps I can illustrate this another way. The sum of all university salaries above the $117,000 threshold in 2003 was around $308 million. In 2023 dollars, that would equal $464 million. But the actual sum of all 2023 salaries above $175,000 was $1.8 billion (with a “B”)!
So, yes, tuition has doubled since 2006–07. And it seems that dramatic increases in high-end employment costs have been a significant driver. As the taxpayers paying for most of this, there’s a question that we must ask ourselves: has the epic growth in university employment delivered value to Ontario – and to all Canada – at a scale that justifies those costs? In other words, are the students now graduating from Canadian schools equipped to successfully enter a demanding job market, navigate a fractured political environment, and strengthen weakened communities? Recent scenes from campus protests suggest that might not be the case.
Which wouldn’t be quite so bad if I could un-see those recent images of the system’s beneficiaries. I mean the images of students incoherently rioting on behalf of savage killers whose territories they probably couldn’t find on a map.
If support staff salaries represent under 3% of payroll (and that's probably an overestimate, since they won't get paid as much as teaching staff and administrators), then growth in the proportion of support staff can't explain an approximately 100% increase in tuition.
Can I ask how you generated figure 1? Statscan does count the numerator (academic staff) but to my knowledge no one counts the denominator (total staff at universities). So what was the source of the data?
Also, I would be careful about equating intl student fees to "cost of education". Institutions charge what the market will bear; in many cases, that's well above cost.