
What Fire Response Statistics Can Tell Us About Our World

The City of Toronto Open Data project includes a helpful dataset covering all fire incidents attended by the Toronto Fire Service (TFS) between 2011 and 2023. There are bound to be valuable insights hidden deep inside the columns and rows. Let’s see what we can discover.
Overall, through those 12 years and 32,929 fire incidents, a total of 1,289 people were rescued and 330 firefighters were hurt. The estimated average property losses per incident were $38,085.
I guess it’s good news of a sort that more than half of the fires for which there was data were in buildings with functioning smoke alarms. Nevertheless there were 948 events where smoke alarms were improperly installed, malfunctioning, or simply not powered. For every 1,000 events where were no working alarms, there were 188 civilian casualties. By contrast, there were only 69 casualties per 1,000 events across the complete set of incidents covered by the dataset. And firefighters were injured at a rate of 16 for every 1,000 events where there were no working alarms vs just 10 for all events.
The most common single possible cause of fires in the database was electrical failures, which account for nearly 10 percent of all incidents. That might partly be the result of some of the missed electrical installation inspections discussed in a recent post.
Although crime rates have been steadily falling since the 1990's - Canada-wide arson rates per 100,000 dropped from 42.89 in 1998 to just 27.39 in 2023 - Toronto still saw 546 cases of suspected arson and 125 cases of suspected vandalism.
When looking at all 32,929 incidents, 111 - including eight incidents of arson and five of vandalism - occurred at a single intersection in downtown Toronto. When I drill deeper into those events I see that the most frequent ignition source identified was smokers objects. When describing the origins of the fires, the most common entries were for Trash, Rubbish Storage which, for the most part, were located on the ground floor.
Even without looking up the intersection on a map, I can safely assume that there’s a homeless encampment in the immediate area where people struggle with drug abuse and intoxication.
This heat map represents all fire events by geographic location. Areas where events occurred with greater frequency appear in orange or - where even more frequent - in red.
Perhaps the concentration of events in the downtown core can be explained by the fact that so many people live in a relatively small area. If that’s true, then the number of fire events would be consistent with the number of residents.
However that’s clearly not true. That fire event visualization isn’t a great match with the following map of Toronto’s population density in 2016 (taken from the CensusMapper.ca site). You can see significant pockets of 200+ people per hectare (colored dark green) well outside the core. I can easily identify the “condo-row”strip of Yonge St. between Sheppard and Finch as one example.
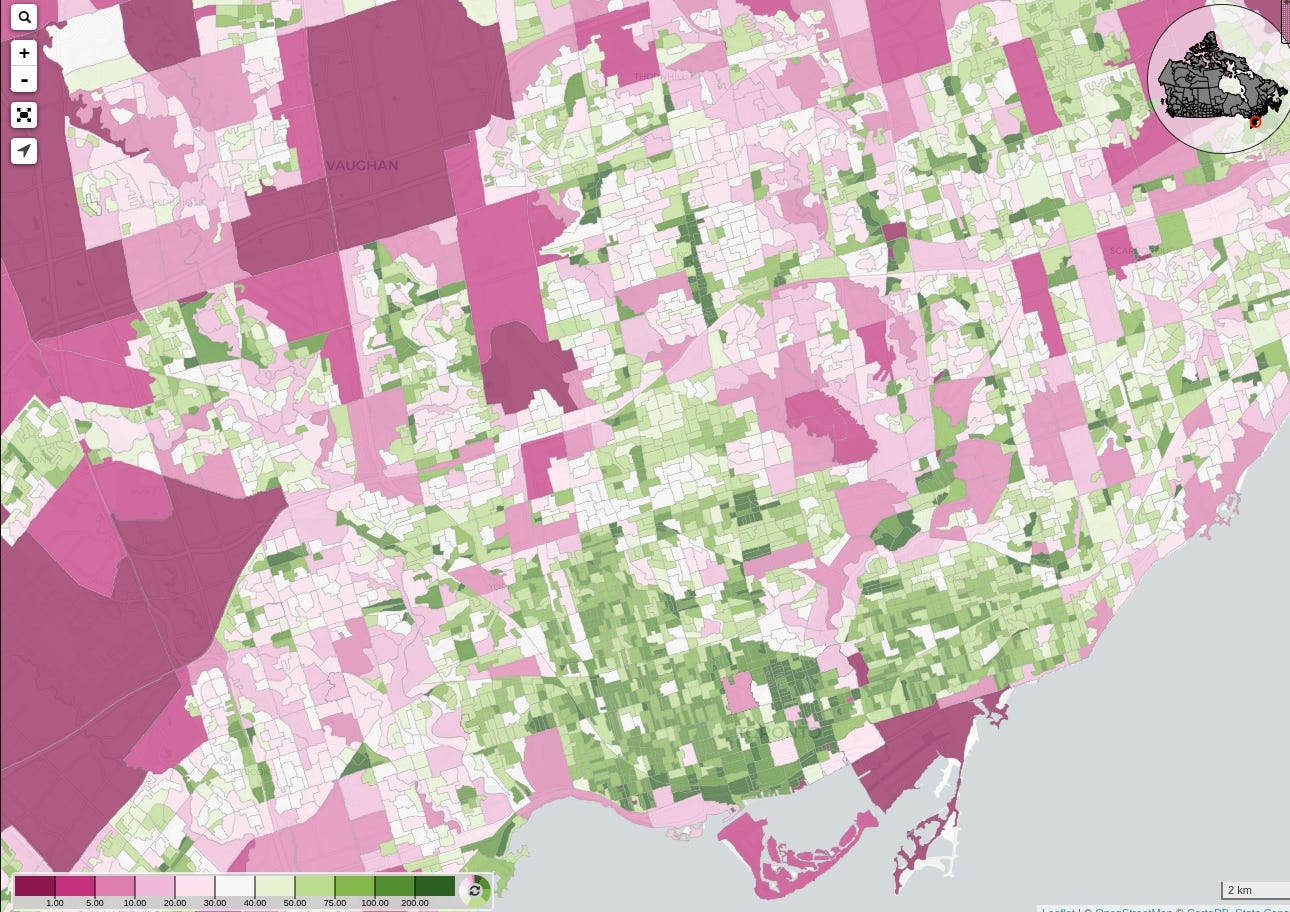
Perhaps it’s the greater concentration of older buildings lacking many modern fire protection construction materials in the downtown core that makes the difference.
A quick look at the graph that follows might lead you to conclude that Toronto Fire Service response times have been climbing. But when you look at the scale of the left axis (average response time in minutes), you can see that the difference between the shortest and longest responses was less than 45 seconds.
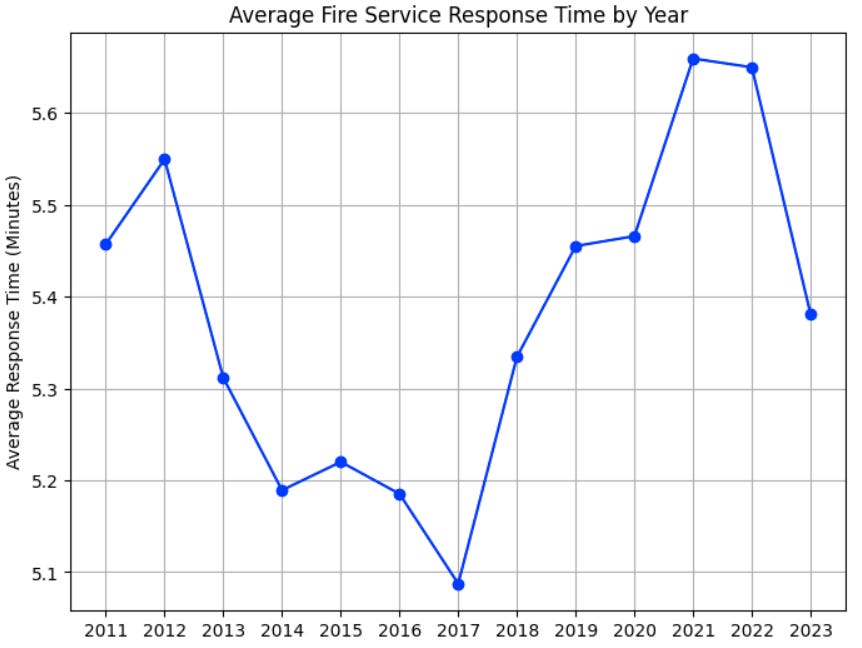
Those relatively quick response times are probably one reason that Toronto firefighters are trained to provide first responder emergency medical assistance. By contrast, the 2023 average response time for Toronto Paramedic Services was approximately eight minutes for sudden cardiac arrests and over nine minutes for other severe emergencies.
TFS responded to 1,567 events where the ignition source was defined as “Vehicle - Electrical”. Of those, the possible cause was determined to be “Electrical Failure” in 881 cases. The most common value entered in the Material_First_Ignited field for those 1,567 events was “Vehicle”, and there were 576 of those.
Given how the Fire Marshal’s standards don’t include a unique code for electric vehicle (EV) batteries, we might be tempted to assume that “Vehicle” here is being used to mostly refer to EV battery-related fires. However when we count the number of events by year, we see that, if anything, incident frequency has been falling since 2011 - even though the number of EVs on the road has grown. There doesn’t appear to be an easy way to identify EV-specific events.
Similarly, although lithium-ion batteries from electric bikes, scooters, and vehicles caused at least 33 files in just the first half of 2023, they don’t seem to be individually identified in our dataset. This gap in the data makes it difficult to assess how serious a threat such batteries pose to public safety.
As usual, this is a very interesting and thought-provoking piece based on solid evidence. Thank you, David.
We can be certain that EV proponents will find a way to keep EV-specific events from being distinguishable.
I'm a huge proponent of open data, but it often is too dirty or at a grain that makes it virtually unusable. One of the absolute worst is Ontario's "Sunshine List". The latest includes over 56,000 (!) different job titles, with 3300 alone for school boards. Trying to determine something as simple as the number of teachers are on the list is an exercise in frustration.