

I once read about a fellow who said he wasn’t interested in seeing how shiny and powerful a new car looked in the dealer’s showroom. Rather, he wanted to know what it looked like after a serious collision. That would give him a good sense of his survival odds.
Last Wednesday afternoon Toronto got hit by a major wind and hail storm, which gave me an opportunity to assess its “serious collision” appearance.
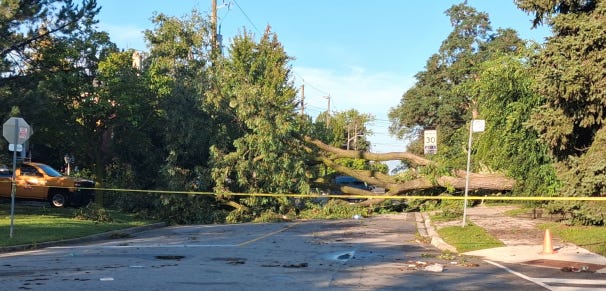
Many of my close neighbors suffered multiple broken windows, damaged roofs, and trees blown down. Many roadways were badly flooded. This tree inspired me to adjust my travel plans the next morning:
In the immediate aftermath of the storm, as many as 65,000 Toronto Hydro customers (including me) lost power. Here’s what Hydro’s outage map looked like:
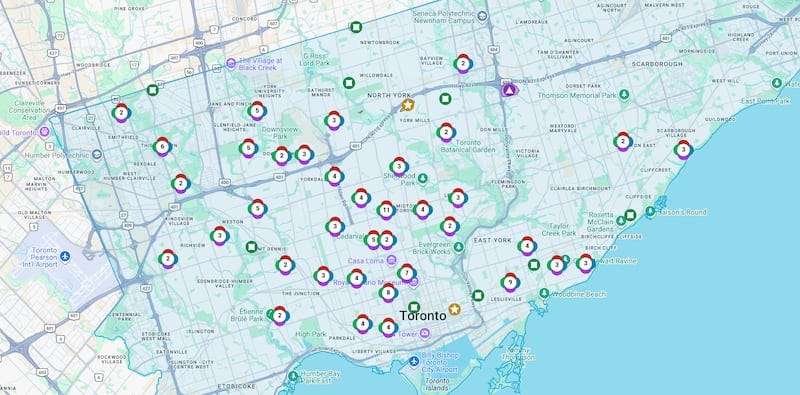
That was the challenge faced by the city and its agencies. All things considered, the response was pretty good. Most of the widespread outages - including mine - had been resolved in less than an hour.
That left a couple of hundred mostly block-level incidents - each involving 5-10 customers - still being addressed by the next morning. Presumably, those involved replacing damaged lines or transformers that had suffered direct physical damage.
All of which got me thinking about my long-term experiences with core City of Toronto utilities. By and large, they seem to work well and when something does go wrong, it gets fixed fast.
But are those just my feelings, or is that institutional reliability measurable?
Let’s see what we can learn about Toronto Hydro. The corporation (whose only shareholder is the City of Toronto) servers 797,000 customers and is responsible for:
188,700 poles
15,424 km overhead wires
14,289 km underground wires
61,630 distribution transformers
That’s a lot of exposed infrastructure. It’s impressive that just 65,000 customers (eight percent of all customers) lost power in a storm capable of pulling roofs off buildings and knocking down enormous trees. But we can find better data sources.
It turns out that there are three industry-standard measures of service reliability:
SAIDI: Total outage time experienced by the average customer in a year
SAIFI: Number of sustained outages experienced by the average customer
CAIDI: Average duration of an outage when a customer actually loses power (which is really SAIDI ÷ SAIFI)
Here are 2024 SAIDI scores for a dozen or so major North American cities:
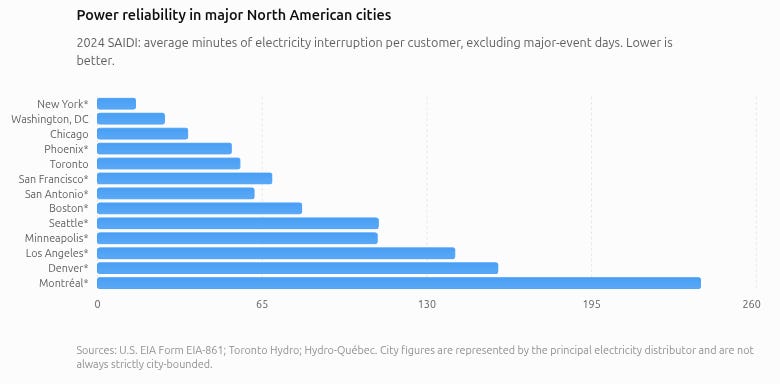
The average Toronto customer lost only 56 minutes in 2024 (SAIDI) across 1.29 outages (SAIFI). The average outage duration (CAIDI) would therefor have been 44 minutes. By all accounts, that’s a pretty good score. Compare that with Montreal, whose customers averaged 436 minutes without power.
One weakness of those raw SAIDI scores is that they don’t take extreme events (like tornadoes and hurricanes) into account. This chart breaks down outages in a way that takes major events into account:
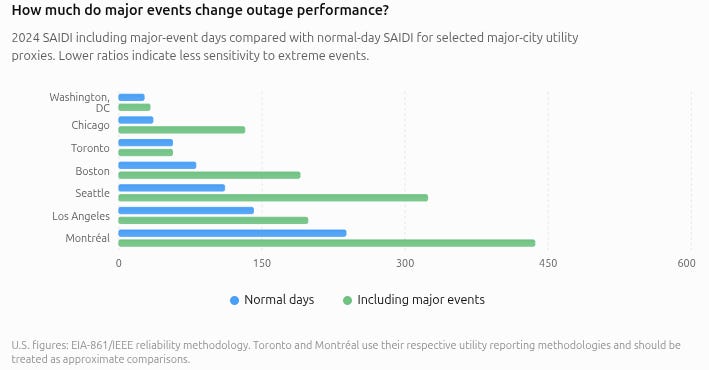
So if you discount blizzards and ice storms, Montreal’s average outage minutes would drop by around 40 percent, while Toronto’s would be unchanged.
For comparison, besides Toronto and Montreal, this report showed Hydro Ottawa customers losing 52 minutes in a year, and Calgary (Enmax) lost just 30 minutes.
Among provincial providers, the scores are significantly higher - which might be partly due to the nature of the communities they serve:
BC Hydro 3.56 hours
Manitoba Hydro 3.2 hours
SaskPower 6 hours
Hydro One 6.79 hours
Overall, we’re doing pretty well here in North America. After all, here’s what things look like in Africa:

Only Mozambique and Cape Verde are competitive.
The bottom line is that, for the most part, Canadians still enjoy first world utility infrastructure. And I’m not complaining.
Thanks for the stats!
Here in suburban Ottawa we once had a hydro pole repaired at night in the teeth of the storm. Amazing work required to achieve those metrics.
I do wish people would keep their trees away from hydro wires. Most outages here are due to homeowner negligence.
I was brought up in Nova Scotia but spent 20 years in Toronto so I agree with your assessment of Hydro One’s performance. You should do an assessment for Nova Scotia Power especially in rural areas. You would find out we lag behind Cameroon by a wide margin.