Ranking Public Education Efficiency by Province
Just increasing education funding might not always make much of a difference
This post is the first of a series of “Rankings” where I - well - rank Canadian provinces against each other for their public policy successes and (dare we suggest) failures. Such comparisons can be a lot of fun, of course. But they can also teach us important lessons about what’s working and what isn’t.
I think we can all agree that if you’re going to do something, you might as well do it well. As a society, we agree to pour mega-mountains of cash into our children’s education. So quality outcomes should be a pretty prominent goal.
Exactly how much cash do we pour into public education in Canada? Well, as Statistics Canada’s school board spending and student population data tells us, per-student spending in 2021 ranged from around $11,986 a year in Alberta all the way to $18,271 in Quebec.
Teachers’ salaries, by the way, accounted for between 50 percent (Quebec) and 77 percent (PEI) of total K-12 education spending in 2021.
But those numbers need some context. Specifically, how successful is each province in educating children?
To be fair, that’s not an easy question to answer. My instinct is to reach for standardized test results that illustrate province-wide averages for proficiency in core curriculum skills. But the value of such averages is hotly contested. And in any case, for both practical and political reasons, like-to-like province-specific test numbers aren’t easily available.
However, while graduating good readers, writers, and arithmaticers is important, the larger goal is to produce productive and successful citizens. Is there a way to measure that kind of success in the public school system’s graduates? I believe that’s something you can indeed measure by looking at the society those graduates defined.
After all, well-educated people are not only more likely to achieve satisfying success, but will also contribute to a more satisfying society for their neighbors. Recent elevated immigration rates notwithstanding, all but a tiny minority of Canada’s adult population came through the public system. So what kind of society have those graduates built?
To figure that out, I designed an Education Success Index made up of five metrics:
High School on-time graduation rates. If a school can’t push its students through the system, then they’re certainly failing in their core mission. The on-time graduation rate is a good measure of how well they’re doing. PEI stands at the top of the list at 92 percent and Quebec shows up at the other end managing only an 80 percent on-time graduation rate.
Employment rate. Finding work is a necessary part of any measure of success in life. The employment rates for all individuals 15 years and older range from 50.3 percent in Newfoundland, to 63.5 percent in Alberta.
Debt-to-Income Ratio. This is a measure of the portion of a household’s income that’s spent on interest payments on debt - including mortgage debt. In many ways it’s a more reliable indicator of a person’s financial health than plain income - which will mean something very different in high-cost cities like Toronto than it would in rural Saskatchewan. A successful education should facilitate greater financial health.
Net business formation rate. A healthy open market economy built on an educated population will see higher rates of business start-up success. The net business formation rate measures the difference between business “entries” (start-ups) and “exits” (failures).
The OECD regional well-being life satisfaction index. PEI scored the highest (a perfect 10), while Newfoundland trailed the pack at just 6.9.
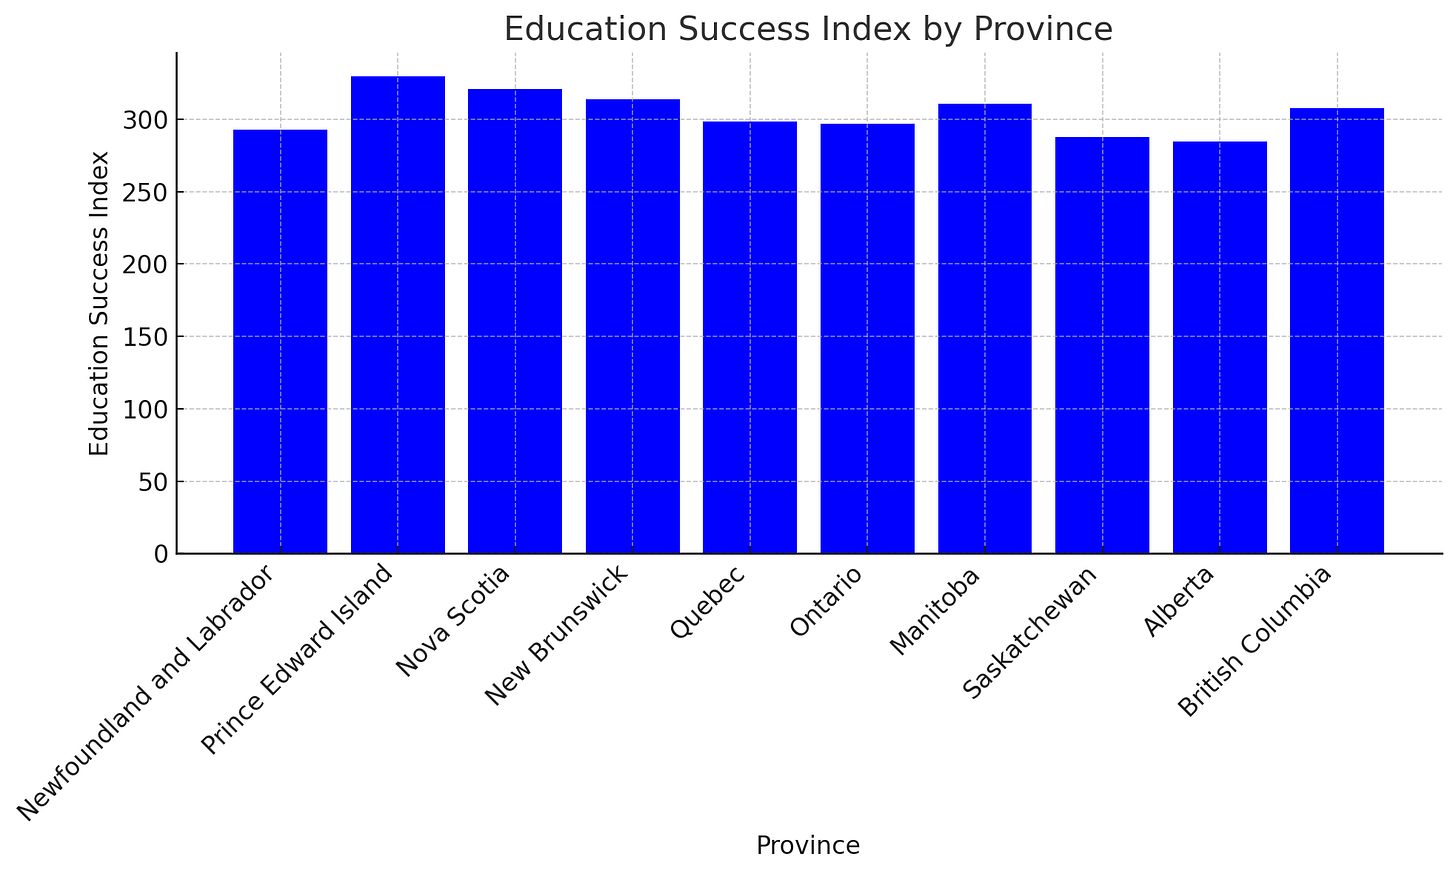
I collected those numbers for each province and, after applying reasonable weighting to normalize their values, combined them into a single number. So, without further ado, I present to you The Audit’s exclusive Education Success Index:
Once again, the overall winner is sunny PEI, followed by Nova Scotia and New Brunswick. Alberta holds up the back end of the list.
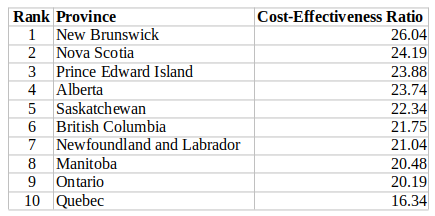
Mapping the per-student spending rates we saw earlier against the outcomes illustrated by my index gives us this cost-effectiveness ratio (CER) - a measure of the efficiency of government education spending. The higher the ratio number, the more efficient the results:
As you can see, Quebec - with its over-the-top spending - scored the lowest by far. Which illustrates what we already should all know: money alone can’t solve stubborn problems.
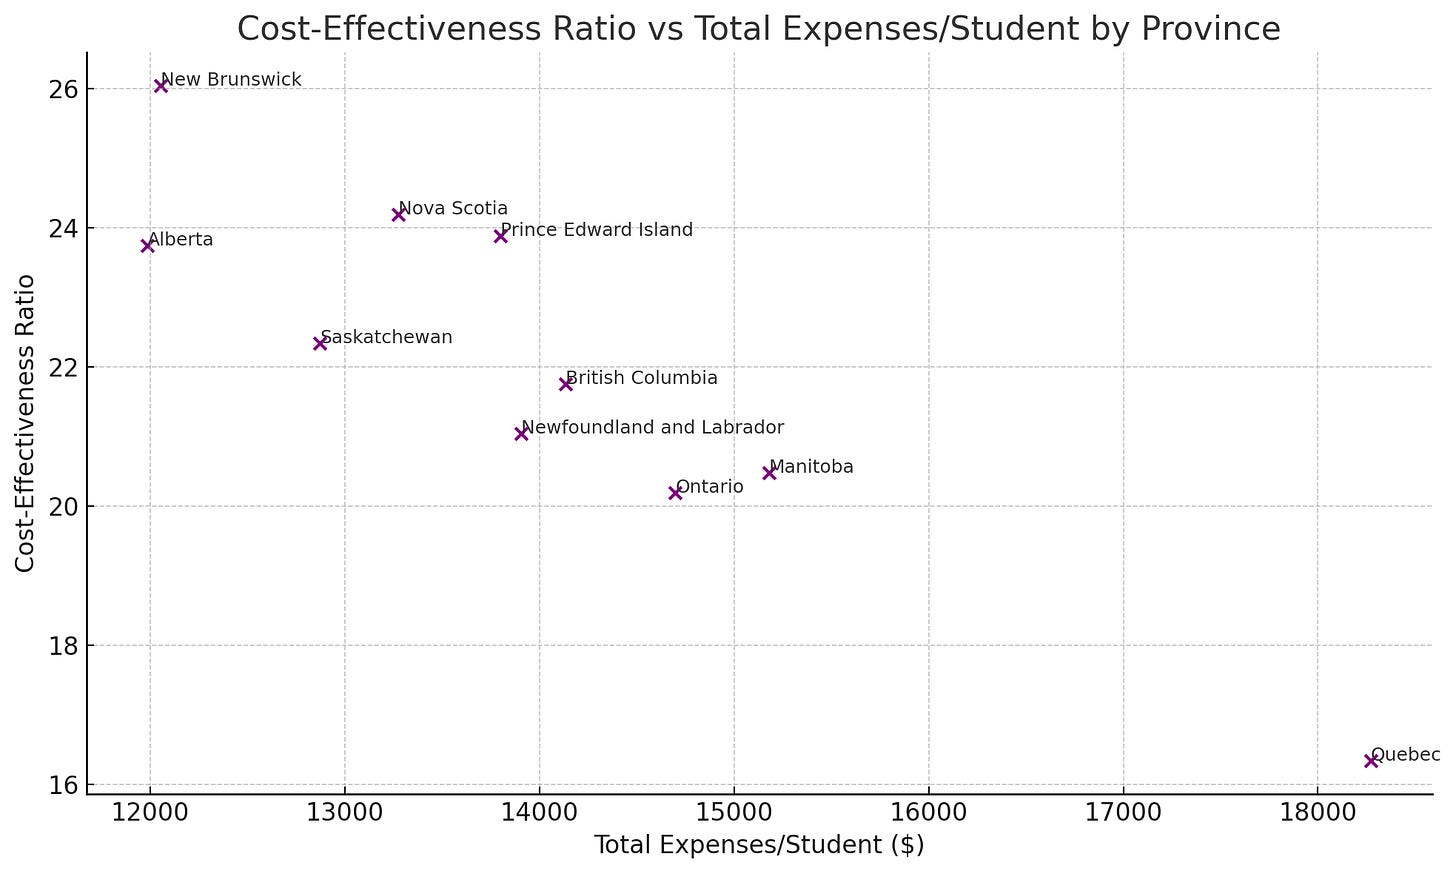
Still, my ratio might not tell us as much about the effectiveness of government policy as we’d like. Perhaps those three Maritime provinces just figured out how to do more with less (which itself would be nothing to sneeze at). What we really want to know is whether there’s a consistent statistical relationship between spending and positive outcomes. Here’s a scatter plot that’ll show us what’s going on:
The negative correlation here is strong: the more provinces spend, the lower their CER values.
Just to give that a concrete number, the Pearson correlation coefficient between the Cost-Effectiveness Ratio and Total Expenses per Student is -0.92, with a p-value of 0.00017 - indicating that this correlation is statistically significant.
Granted, the statistical sample here is very small: just the ten provinces. And it’s also proof of correlation rather than causation. But I believe it does blunt the oft-repeated claim that educational failures are mostly the result of underfunded schools.
There’s definitely some yummy food for thought here.


What is you suggestion for cracking that last nut. If not funding, what is (are) the decisive factor(s)?
This is an interesting snapshot, but it fails to relate curriculum content and well-being scores. Finland amongst other progressive education approaches measures their system without academic scores in the form of testing for the first 7 years. I've spent a lot of time looking at education globally and visited many countries for this reason. Standardized testing is a huge problem and most progressive education systems that score high on the PISA's don't do it. I would suggest that if we continue to measure the provinces by how they perform with the current curriculum content and measuring tools, we are living in the dark ages.