Ranking Provinces by Mental Wellbeing
Quebecois feel they're the happiest Canadians. And it's not even close.
Is there a part of the country where people are measurably happier? Is it possible to identify what’s working so we can emulate it elsewhere? Perhaps some Statistics Canada data can help move this important conversation along.
The datasets I worked with fell into two categories:
Ways populations perceive themselves
Cause of death numbers
Self-Perception Survey Data
Specifically, the Statistics Canada perceptions data was based on surveys from 2022 that included questions asking people to assess their own mental health.
Responding “yes” to some of the questions would imply positive reactions. Those included:
Perceived mental health (very good or excellent)
Sense of belonging to local community (somewhat strong or very strong)
Life satisfaction (satisfied or very satisfied)
Other questions implied more negative states:
Perceived mental health (fair or poor)
Perceived life stress (most days quite a bit or extremely stressful)
Mood disorder (perceived)
Anxiety disorder (individuals who reported that they have been diagnosed by a health professional as having an anxiety disorder)
Heavy drinking (males who reported having 5 or more drinks, or women who reported having 4 or more drinks, on one occasion, at least once a month in the past year)
The data was presented as percentages of total respondents. To get a single number representing the results from all of those questions, I subtracted the average number of “yes” responses to the negative questions from the average number of “yes” responses to the positive. The result was the “net average” score.
The average overall net average self-perception score for all ten provinces was 51.2. But there was quite a spread: British Columbia and Nova Scotia both came in at around 49, while Quebec was way ahead of the pack at 56.
Even though they’re based on subjective self-reporting, such numbers are important. For one thing, more often than not, self-perceptions are likely to reflect reality. But such responses can also tell us a lot about population trends that, in turn, can point us to systemic problems that need addressing.
Specifically, I’m curious about what conditions unique to Quebec could have led to their strong showing here. Are there cultural peculiarities that either promote health or, conversely, suppress open discussion? Or is healthcare infrastructure in Quebec just that much better than in the rest of the country?
Curiously, while having a “sense of belonging” resonated strongly with Maritimers (74 percent of Newfoundlanders in particular agreed with the question), this was Quebec’s only poor score in this section. Only 58 percent of Quebecois were comfortable in their communities.
Mental Health-Related Data
I thought it would be useful to balance provinces’ self-reported health with a hard, objective standard. So I used these two Statistics Canada datasets for age standardized mortality rates in 2022 for these mental health-related causes:
Alzheimer’s
Vascular dementia
Unspecified dementia
Intentional self-harm (suicide)
The numbers I chose all present death rates per 100,000 population so we’ll be able to effectively compare the experiences of both larger and smaller provinces. Nova Scotia had much higher Alzheimer’s and vascular dementia mortality rates, while unspecified dementia rates were significantly higher in PEI - 31 percent above the all-province average. Because the absolute rates are all, thankfully, quite low (ranging between 38 and 68 per 100,000), these differences might be exaggerated by the small sample size.
Saskatchewan reported the highest suicide rate (15.2 per 100,000, vs an all-province average of 10.3). The data didn’t break out assisted suicide numbers from the general data.
In any case, I simply added all four death rates into a single number to represent each province’s “cause of death” state. That gave me everything I’d need to create a wellbeing index.
Building a Mental Wellbeing Index
To generate a single number for my index, I had to deal with the fact that the cause of death numbers are negative (i.e., the higher the number, the greater number of people who have died), while the net average perceptions number was positive (meaning that the higher the number, the healthier people are).
So I inverted the cause of death numbers by subtracted them from 130. Why “130”? Because that would also serve to normalize the values, making them roughly equivalent to the perception values (thereby giving them equal weighting). I then added those two values together to produce my index.
I know that trained economists and actuaries may be appalled by my primitive methodology. But at least I let you look through my data for yourselves.
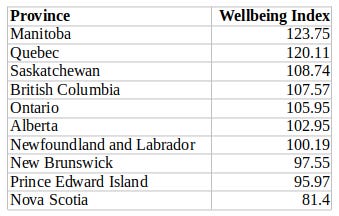
Here, all things considered, is The Audit’s provincial mental health wellbeing index:
Quebec’s amazing self-perception scores weren’t enough to carry it past some disappointing suicide and Alzheimer’s rates. But coming in a close second behind Manitoba isn’t a terrible outcome by any measure. On that score, Manitoba’s excellent results are largely a product of mortality rates that were 25 percent lower than the all-province average.
It’s also remarkable that the Maritime provinces, despite some solid self-perception, were all dragged down by consistently high mortality rates.
This ranking probably doesn’t have a lot of objective value. After all, the index is constructed from some fairly arbitrary choices. But I think it does surface some of the ways public policy, healthcare infrastructure, and culture can, combined, impact individual health outcomes. Intelligently adjusting even one of them could improve the whole package.


Really interesting data and analysis. The statistics with respect to suicide in Québec are long-standing - this is no recent phenomenon and yet it’s unclear why there has not been more attention paid to it by governments of all stripes in the past several decades.