
Are We Winning the Patient-to-Doctor Ratio War?


The fact that millions of Canadians lack primary healthcare providers is a big deal. The grand promise of universal healthcare rings hollow for families forced to spend six hours waiting in a hospital emergency room for a simple ear infection diagnosis.
Just how big a deal is it? Statistics Canada data from 2021 ranks provinces by their ability to provide primary health providers. As you can see from the chart, New Brunswick and Ontario were doing the best, with doctors for nearly 90 percent of their residents. Quebec, able to find providers for just 78.4 percent of their population, landed at the bottom. But even just 10-15 percent without proper coverage is a serious systemic failure.

Since healthcare is administered by the provinces, it makes sense to assume that provincial policies will influence results. So comparing access to primary care practice results over time might help us understand what’s working and what isn’t.
To that end, I pulled Statistics Canada data tracking total employment in offices of physicians (NAICS code 621111) by province. The data covers all employees (including nurses, office managers, and receptionists) in all non-hospital medical offices providing services that don’t include mental health.
I originally searched unsuccessfully for usable data specific to doctors. But as it turns out, such data would have included surgeons and other hospital-based specialties when I’m really looking for general (family) care providers. So I think what we got will actually act as a better proxy for primary care access.
Do keep in mind that staffing levels in the sector represent just one of many statistical signals we could use to understand the healthcare universe. And it’s just a proxy that’s not necessarily a perfect map to reality.
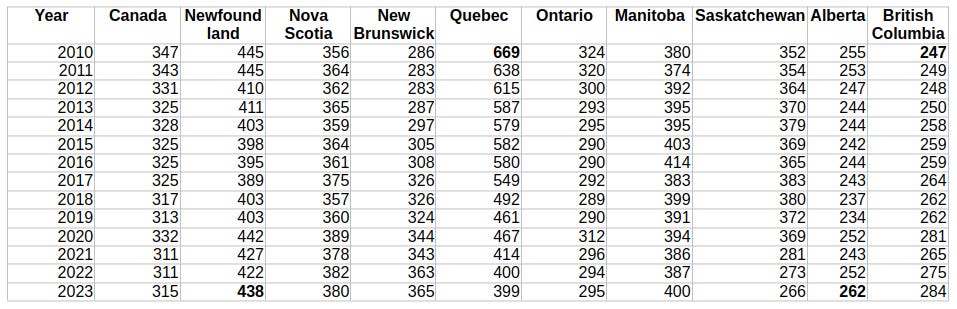
In any case, I adjusted the numbers by provincial populations so they’d make statistical sense. The chart below contains ratios representing how many residents there are per worker between 2010 and 2023:
You might notice that PEI is missing from that chart. That’s because the reported numbers fell below Statistics Canada’s privacy threshold for most of the covered years.
Alberta, with a ratio of just 282:1 is the current champion, while Newfoundland (438:1) has the worst record. But changes over time are where things get interesting. BC’s performance declined by more than 11 percent. And Quebec improved by more than 40 percent!
As you can see for yourself in that chart, Quebec’s most dramatic growth took place between 2016 and 2019. What was going on around that time? Well, both Bill 10 and Bill 20 were introduced in 2015.
Bill 10 restructured the healthcare system by reducing the number of administrative regions and centralizing governance to streamline services and improve efficiency.
Bill 20 established patient quotas for doctors, mandating a minimum number of patients they were required to see. Physicians who did not meet these quotas faced penalties, such as reduced compensation.
I don’t need to speak French to assume that those measures must have inspired an awful lot of anger and push back from within the medical profession. But the results speak for themselves.
Or do they? You see there’s something else about Quebec we can’t ignore: Chaoulli v. Quebec (2005). That’s the Supreme Court of Canada case where the Canada Health Act’s ban on private delivery of healthcare was ruled unconstitutional (for Quebec, at any rate).
As a direct result of that decision, there are now more than 50 procedures that can be performed in private surgical clinics in the province. The number of private clinics nearly doubled between 2014 and 2023.
Predictably, wait times for surgeries fell significantly over that time. But the numbers of non-hospital employees would probably have climbed at the same rate. That could possibly go further to explain Quebec’s steady and consistent improvements in our data.
What about the other provinces? There have been structural changes to delivery policies in recent years, but they’re mostly too new to have produced a measurable impact. But here’s a brief overview of what’s being tried:
This Toronto Star piece describes efforts in both Ontario and BC involving plans among some smaller municipalities to build and manage family health practices and pay their doctors as employees. The idea is that many doctors will prefer to avoid the headaches of starting and running their own businesses and would prefer instead to work for someone else. The obvious goal is to attract new doctors to underserved communities. It’s still way too soon to know whether they’ll be successful in the desparate race for the shrinking pool of family physicians.
Both Ontario and Alberta have championed Family Health Groups (FHGs), where physicians receive additional incentives for providing comprehensive care. Ontario’s Family Health Networks (FHN) and Family Health Organizations (FHO) also compensate physicians based on the number and demographics of enrolled patients.
British Columbia and Nova Scotia have implemented variations of a Longitudinal Family Physician (LFP) Payment Model. LFPs compensate family physicians based on factors like time spent with patients, patient panel size, and the complexity of care. They claim to promote team-based, patient-partnered care.
Quebec allows private clinics, and surgical wait times miraculously drop. Who’d a thunk it? That suggests that the biggest problem in Canadian healthcare is, er, central planning. Let’s face it, we have a Soviet healthcare system: the only countries in the entire world that emulate it are Cuba and North Korea. Every country in Europe has some combination of private and government healthcare. And they’re all cheaper, faster and better than ours.
The annihilation of our healthcare system, including the elimination of private physicians, suppressing cancer cures as a means to population control, limiting access to affordable healthcare for the elderly here and around the world, and inducing heart attacks as a form of assassination was planned 60+ years ago by the members involved in the creation of the NEW WORLD ORDER now rebranded as The GREAT RESET. This was addressed in a March 1969 speech given in Philadelphia by Dr. Richard Day. The WEF UN WHO are all intertwined. Their sole mission is world domination through depopulation, creating a ONE WORLD government, healthcare, military, financial system, military and religion. Both Bush Sr. and Clinton gave speeches about "achieving a New World Order". The current WEF regime of billionaires and politicians is working tirelessly to attain their goal at the overwhelming detriment to the citizens of the world.