
Do Government Controls Over Alcohol Sales Work?


The Government of Ontario created the Liquor Control Board of Ontario (LCBO) all the way back in 1927. The Crown corporation represented a first step away from prohibition: alcohol sales were now legal, but tightly controlled by government regulation.
By all accounts, the LCBO has done well for itself. Its 2022-2023 annual report informs us that their 685 stores, 449 wholesale customers, and 389 convenience outlets sold around 1.1 billion litres of alcoholic beverages worth an estimated total of $10 billion.
As a Crown corporation, LCBO is expected to transfer excess revenues to the Government of Ontario as dividends which, we’re told, are used for healthcare, education, and infrastructure. In 2022-2023, that dividend came to $2.58 billion - a record haul. In addition, LCBO reports having made $14.6 million in charitable donations during that year.
All that’s nice, but it effectively amounts to a consumption tax by another name. And that’s something whose value Ontario citizens should be allowed to judge for themselves. If the restrictive policies that shape the LCBO’s mandate are, in fact, effective at protecting the community’s health and well being, then that’s a strong argument in its support. But is it effective?
Well it turns out that we’ve had nearly a century’s worth of data to work with.
Alcohol Retail Policies by Province
All ten provinces restrict alcohol sales to minors and after hours, limit alcohol advertising, and require licenses for bars and restaurants that serve alcohol. But the provinces are conveniently divided by how they allow the retail sale of alcohol: Ontario and the Maritime provinces all impose strict, LCBO-like government oversight, while Quebec and everything west of Ontario are far less invasive:
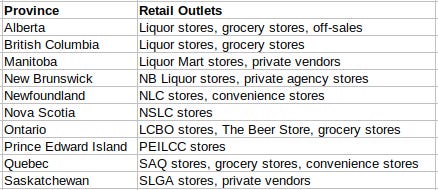
That means we can compare the health and social outcomes from the five “controlled” provinces with their cousins in the five “uncontrolled” provinces. This is useful, because the larger and more diverse our control populations, the less likely we’ll be tripped up by confounding variables like significant economic or cultural differences. In other words, doing head-to-head comparisons based on experiences in PEI vs Ontario will have limited value. But grouping sets of five provinces together increases the chances that we’re learning something useful.
Outcomes by Province
I used the most recent Statistics Canada data available to rate provinces in four areas:
Alcohol-related mortality rates, including malignant neoplasm (cancer) of the liver, larynx, trachea, bronchus, and lung; alcoholic liver disease; and other chronic liver diseases and cirrhosis
Substance abuse disorder rates
Impaired driving violation rates
Average annual household spending on alcohol tobacco, and, recreational cannabis
I then took the most recent data I could find and calculated the average for each provincial group (“controlled” and “uncontrolled”). Here’s how it looked:
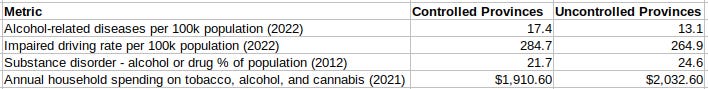
It seems that jurisdictions with less controlling policies enjoyed lower alcohol-related mortality (just 13.1/100k as opposed to 17.4) and lower rates of impaired driving violations (264.9/100k vs 284.7). At the same time, highly-controlled populations spend less on alcohol and suffer substance disorders at a noticeably lower rate.
What I don’t see is any clear whole-of-system social and healthcare benefits to justify the costs associated with greater control.
Sure, no government would enjoy giving up the $2.58 billion that Ontario took in last year. But it’s not really their money to take, is it?
Interesting. I always just thought liquor control boards were there to generate money for their governments. I never dreamed they were supposed to be a deterrent for consuming alcohol. In fact those two goals could not exist together.
A good one, David. Thank you!