Government Climate Policy and Ambiguous Data
Do we understand what's driving changes in extreme weather event frequency and severity?
Understanding large, complex systems is hard. That, after all, is why they call them “complex”. And there’s probably nothing more complex than the interplay between our physical environment, the billions of human beings who live in it, and the global economy.
It’s perfectly reasonable to ask whether human actions are changing the environment, whether environmental trends are changing the way human beings live (and die), and how all of it is is impacted by the economy. It’s probably not reasonable to expect clear and unambiguous answers. And it’s probably equally unreasonable to base expensive government programs on ambiguous data.
I’m not going to try to address the big-picture questions. Even fully understanding what’s already happened is well beyond my humble capacity, and predictions are completely out of scope. But I would like to discuss the oft-repeated claim that, in relation to historic norms, extreme and destructive weather events are becoming measurably more frequent.
To be honest, there are many strongly-held opinions and nearly as many large datasets flying around relating to this topic. Historical hurricane and tropical storm data produced by the Geophysical Fluid Dynamics Laboratory of the US Government's National Oceanic and Atmospheric Administration (NOAA), for example, suggests that there has been no statistically significant change in the frequency or intensity of Atlantic hurricanes over the past century. But that’s just one dataset covering just one event category. And it’s only tangentially relevant to what’s happening in Canada.
So let me introduce you to Public Safety Canada’s Canadian Disaster Database (CDD). The database attempts to enumerate and describe all the disasters impacting Canada over the past 120 years. To build a picture of trends over time, I selected the approximately 900 meteorological and hydrological events beginning in 1900 that involved significant destruction.
The data isn’t perfect. As the maintainers themselves warn:
The CDD may not be suitable for comparative analysis because of differences in jurisdictional responsibilities, the type of data that is available, and how it is collected and used over time.
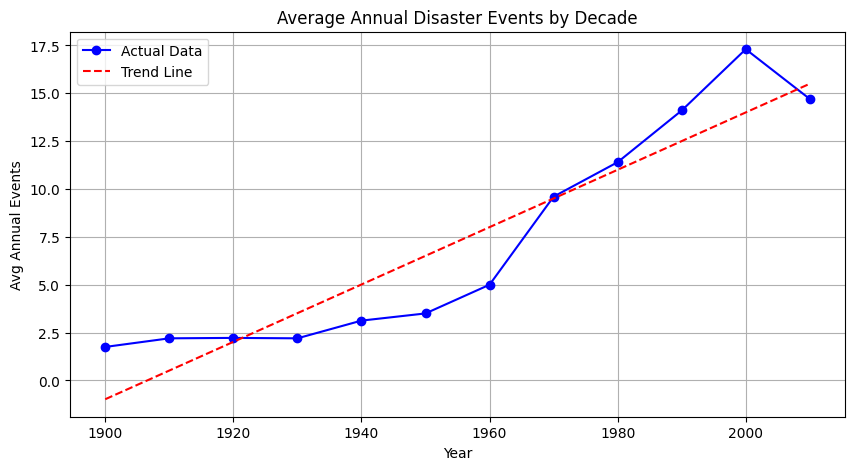
With that in mind, let’s see what the data at least appears to show us. Here’s a chart displaying the number of annual disaster-level events as measured in decade averages.
Although it would be hard to see from the graph, the numbers themselves show us that fully 25% of the events took place just since 2008.
The scope of the dataset we’re working with would seem to be large enough to accurately represent statistical trends. And the frequency of events is certainly rising. But does it necessarily follow that changing climate conditions are fully responsible for all this? Perhaps there are some other contributing factors to consider, including:


