
Assessing Canadian Charities for Value

There are more than 82,000 registered charities competing for your donations in Canada. Assuming that you’ve got only finite funds available, you’ll probably want to support just the organizations that’ll give you the biggest bang for your buck.
If you happen to have a personal connection with an organization that you know does good work and is well run, then you’re in business. But trying to understand charities from the outside is challenging.
U.S. online services like Guidestar (that now seems to mostly go by the name Candid) have historically published fundraising ratios for organizations as an assessment tool. The thinking is that a charity that spends 95 percent of its revenue on administration and fundraising probably has very little left for actual charitable activity. Why spend money supporting a self-licking Popsicle?
Since the CRA publishes detailed information on the charitable tax filings for all Canadian charities, generating spending ratios is simple enough. And researching the results of any one charity is even easier thanks to the charitydata site. Since I’ve got access to the complete 2024 dataset, I’m going to take a look at sector-wide trends.
But I should first note that there are limits to what ratios can tell us about an organization. For one thing, many charities make simple accounting mistakes when completing their 3010 filings. Such mistakes can innocently mislead researchers.
As an example, I came across one group who reported spending 738,740 times more for administration than for charitable activities. Realizing that simply wasn’t possible, I took a closer look and saw that they’d reported just one dollar for charitable activities despite employing more than half a dozen people who were obviously working to carry out their charitable mandate (it’s a busy community church).
Ratios can also legitimately misrepresent normal business activities. Sometimes a well-run organization with strong systems, good data, and professional staff may spend more on administration and deliver better outcomes than a lean operation running on volunteers and goodwill.
Similarly, a one-time capital investment can make an organization appear to be hopelessly inefficient when the spending was really designed to improve outcomes a decade into the future. Context is important, and “blind” ratios won’t always pick that up.
Of course, “mistakes” happen both ways. It’s apparently common for administrators to categorize purely administration costs as though they’re charitable activities. That’ll improve their ratios and reduce their chances of getting red-flagged by CRA. But it’s not an honest representation of their financial profile.
With those caveats in mind, here are system-wide trends based on four different ratios, each with its own strengths and weaknesses.
Administrative Expenses as a Proportion of Charitable Activities
CRA expects charities to report management and administrative expenses separately from fundraising expenses. So this ratio looks at just management and administrative costs in relation to the expenses reported as charitable activities.
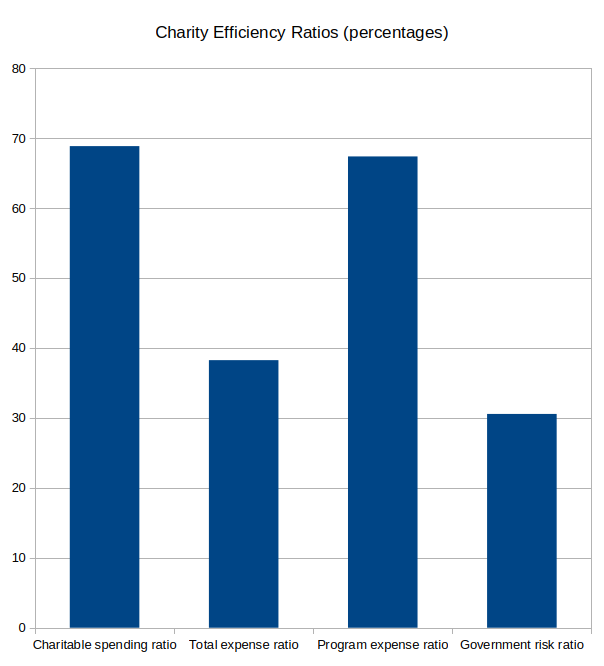
Across the 50,334 charities for which the necessary data exists, administration costs made up less than 25 percent of charitable spending for nearly 69 percent of charities. In other words, around seven out of ten Canadian charities direct less than a quarter of their spending to administration.
If you’d like to test a particular charity for yourself on this metric, simply divide line 5010 (Total expenditures on management and administration) by line 5000 (Total expenditures on charitable activities). You can find those numbers on the charity’s charitydata page.
Fundraising Costs as a Proportion of Fundraising Revenues
This measure will give us a sense of an organization’s level of efficiency (or inefficiency). You can reproduce it by adding up all costs (lines 5010 and 5021) and separately adding up all fundraising revenue (lines 4500, 4510, and 4530). You would then divide the costs total by the revenue total.
Based on that, the total costs of 38.25 percent of all charities represent less than 50 percent of total revenue.
Program Expense Ratio
It can also be useful to examine the relationship between total charitable program spending (line 5000) to total expenses (line 5100).
When I divided the charitable spending into overall spending, I found that the ratio of more than 67 percent of charities was 70 percent. Or, to put it differently, just seven out of ten charities directed more than two thirds of their spending to actual charitable activities.
Government Revenue Ratio
The final ratio is focused mostly on exposure to external risks. The continued existence of a charity that depends on government for most of its funding will depend on policy decisions that it can’t control. So it’s worth assessing how vulnerable a particular organization is to such risks.
In Canada, charities like hospitals or school boards are, by definition, locked into this kind of vulnerability. But measuring the extent of the dependency can help with a full assessment.
As it turns out, only 31 percent of charities received less than a quarter of their total revenue from federal (line 4540), provincial (4550), or municipal (4560) sources. The remaining 69 percent face significant exposure to this particular risk.
To help you visualize all this, the chart represents institutional “compliance” percentages for each of the four ratios. In each case, the higher score, the greater an institution’s efficiency or stability.
Should CRA up its audit game to encourage better financial practices among Canadian charities? I certainly can’t say. Although it probably wouldn’t hurt to pull back on politically-driven crackdowns so it can focus more on its core mandate.
But what’s clear is that there are public-facing tools we can all use to be far more discriminating about the causes we choose to support.
There’s much more on charity in Canada that’s available for you to read here.
It might be a good idea to start with defining what is and what isn’t a charitable organization subject to tax relief for donors. There are many organizations that could be seen as “charitable” in name only where donations generate a tax receipt for donors. Many of those organizations are more in the way of lobby groups and/ or ideological, activist organizations not deserving of tax relief for donors.