
Is Mississippi Really Wealthier Than Every Canadian Province?
Nope. And it's not even close.

Not too long ago, most of us heard the claim that the average citizen of nearly every Canadian province was poorer than the average citizen of even the poorest U.S. state (Mississippi). Of course, measuring “wealth” is notoriously complicated, so there’s not going to be any way to definitively support that claim. But I think it would be useful to explore some options.
The most common tool for the job is per capita gross domestic product (GDP). The problem with many flavors of GDP however, is that they’re really measuring economic activity, rather than household income or wealth. Also, currency fluctuations can help mask the results of GDP comparisons between countries.
PPP-adjusted GDP per capita (Purchasing Power Parity) can be a lot better. But there doesn’t seem to be any easily-available PPP-adjusted GDP-per-capita dataset for all 50 U.S. states and all 13 Canadian provinces/territories. So, practically speaking, that’s out.
So I thought I’d gather together six (mostly) economic metrics describing both U.S. states and Canadian provinces and use them to build my own wealth index. With a little luck, we’ll get enough useful data for a passable comparison. You should feel free to download my spreadsheet containing my raw numbers and calculations.
I began with the latest mortality rates from Statistics Canada and World Population Review. It’s widely accepted that a population’s wealth is an accurate predictor of health and longevity. So living longer (or, more accurately, experiencing fewer deaths per year) would suggest the possibility of greater population-level wealth.
There are six U.S. states with higher mortality rates than even the worst Canadian score (which was Newfoundland at 11.5 deaths per 1,000 population). Canada’s best score (Ontario: 7.4 deaths) would rank behind just Utah and District of Columbia in the U.S. Overall, the provinces at least appear healthier (and therefore wealthier).
Next up was unemployment. The overall average unemployment rate of all U.S. states was just a hair over four percent, while the average of all ten provincial rates1 was 6.96. The top province here was Saskatchewan whose 5.2 percent rate would rank it 47th among states!
The percentages of people living below the poverty level in the U.S. was far higher than the numbers here in Canada. The average of all provincial rates was 10.86, compared with 12.62 in the U.S.
Home ownership is one place where we’d expect to see greater stress here at home. After all, even with the collapse of the condo markets in Toronto and Vancouver, buying even a tiny home on a typical Toronto or Vancouver income is mathematically virtually impossible.
To avoid currency and purchasing power mismatches, the best way to go about this is to calculate the income-to-housing ratio. So I took the median employment income for every state and province and divided that into the median home price for each state and province. The result is the number of years it would take for someone earning the local median income to pay for the average home (assuming every penny of income went into the purchase).
Bear in mind that we’re using provincial averages. That means Ontario’s 5.14 ratio isn’t something anyone in Toronto is ever likely to see. But the same will apply to, say, Manhattan vs Upstate New York.
That 5.14 ratio would, as it turns out, place Ontario in 25th spot among states. And Alberta’s 2.99 score - Canada’s best - would easily beat Iowa (3.37) the best in the U.S. I’m not sure how Newfoundland ended up in last place domestically with a 10.4, but only Hawaii (12.74) scored worse.
So while housing affordability is certainly a problem here, it’s not necessarily all that much better south of the border.
To incorporate the rental experience, I also calculated median rental costs by state (using table GCT2514) and province into median income. This will give us the percentage of income the average resident who rents living accommodation spends on shelter expenses. To get numbers for Canadian renters, I adjusted the “rented living quarters” numbers2 (which are an average of rental expenses incurred by all Canadians - even those who own their homes) to cover just the segment of the population who actually rent.
Here I got a real shock. The most expensive province (BC, where renters spend 10.73 percent of their income on housing) would have been the third least expensive state! It’s possible that the U.S. and Canadian numbers aren’t measuring exactly same things. I guess it’s also possible that Statistics Canada’s numbers underestimated rental expenses. But that’s what I’m seeing right now.
The final metric I used for my index was all income tax expenses as a percentage of income. That is, what’s the total federal, state/provincial, and municipal burden and how much of your income is left once taxes have been paid. As with rents, I’m not 100 percent sure that the U.S. federal and state/local numbers are measuring exactly what Statistics Canada’s income tax metric represents. But it’s probably not that far off.
Quebec is the province where the tax burden (25.78 percent) was highest. Only seven states cost their residents more. Saskatchewan, who pay just 16.8 percent of their income to governments, would have come fourth in the U.S. - behind just Wyoming and the two Dakotas.
Which is another way of saying that Canada’s tax-burden distribution isn’t all that different than the U.S. Note, however, that I didn’t include healthcare or post secondary education expenses in this comparison. If anything, those would tilt the results still further against American wealth.
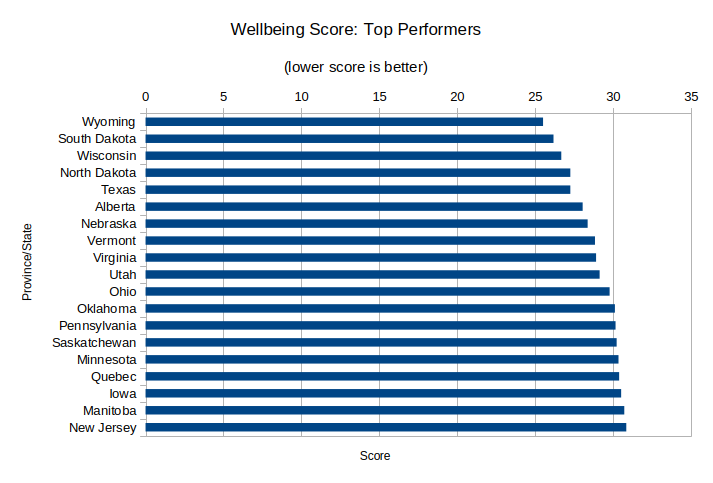
Now let’s take a look at the index I created from all of those data points. Mississippi, by the way, ranks 32nd among U.S. states. Overall, as you can see from the first chart, four provinces (Alberta, Saskatchewan, Quebec, and Manitoba) ranked among the top 14 U.S. states.
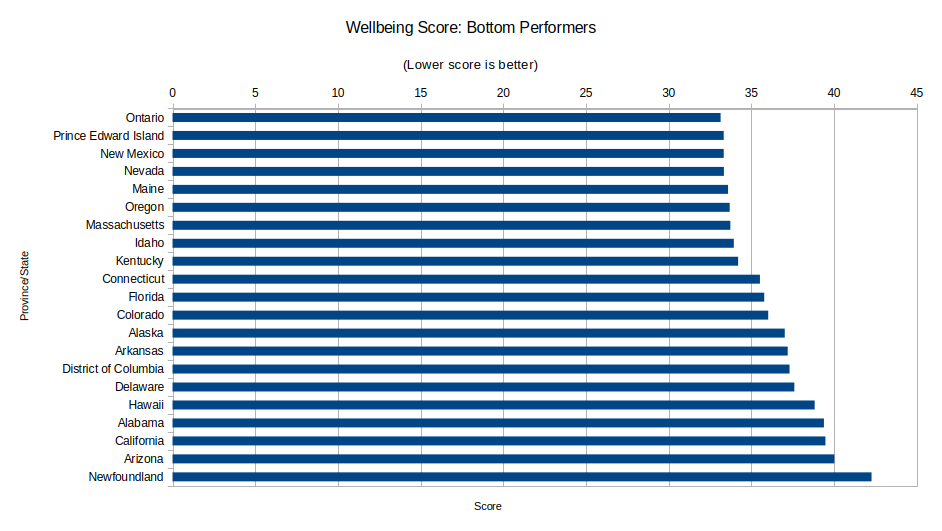
And three provinces (Ontario, PEI, and Newfoundland) showed up among the bottom 18 states:
The most obvious conclusion to draw from all this is that there are significant economic differences between provinces and states. But there isn’t any clear pattern differentiating between them based exclusively on country.
Which is not the same thing as the national rate.
Based on its documentation, the metric - titled rented living quarters - covers rent, tenants’ repairs and improvements, tenants’ insurance premiums, and parking at rented living quarters.